How to Improve Your Trade Timing with Enhanced Seasonality Features
Longtime readers of this column know a few of my favorite TradeSmith indicators include our Trade Cycles market timing indicators and our Business Quality Score.
But our software development team is constantly working to add new indicators, on top of improving the existing ones, so my list of favorites is growing fast. One of those new features is a key enhancement to our Trade Cycles Seasonality filters.
And if you haven’t used these tools already, here’s a quick tutorial on how to make the most of these terrific enhancements to better time your trades.
Trade Cycles and the new Seasonality filters are available to subscribers of our Trade Cycles product, as well as TradeSmith Essentials and TradeSmith Platinum. (And if you don’t see these indicators in your TradeSmith Finance dashboard — and would like to — call 888-623-0858 to learn more.)
This subscription gives you access to our state-of-the-art market-timing tools. Simply pull up any stock, index, ETF, or other asset class by typing the ticker symbol in the Search for Ticker space at the top right of any page within TradeSmith Finance. That will bring you to this page, using Alphabet (GOOG) as an example.
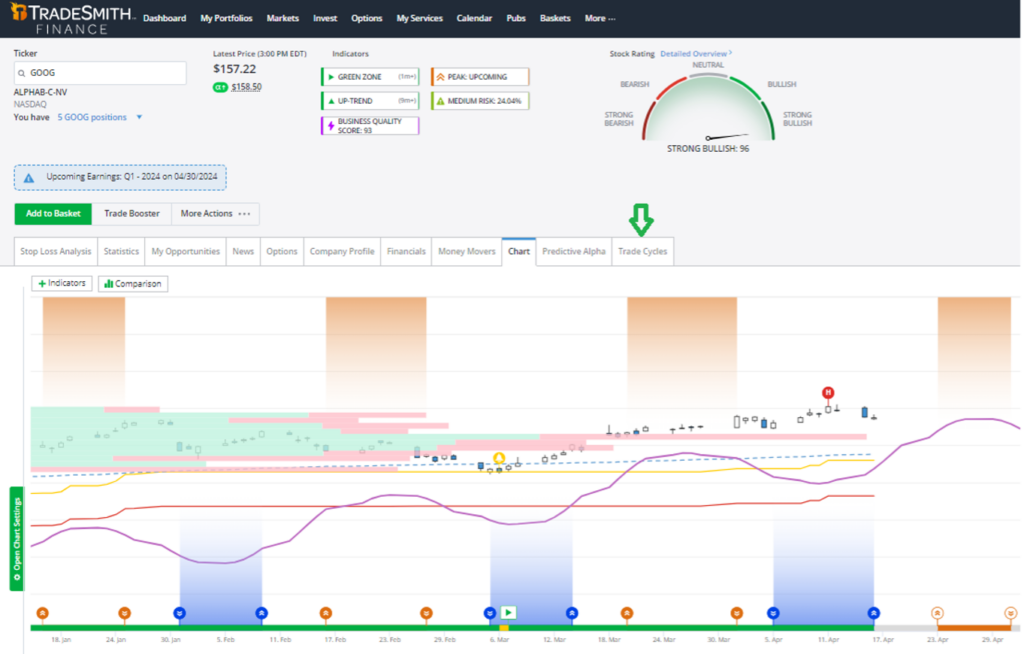
The page opens showing the Chart tab, but you’ll want to click on the Trade Cycles tab further to the right.
First, you’ll see our exclusive Trade Cycles historical patterns chart…
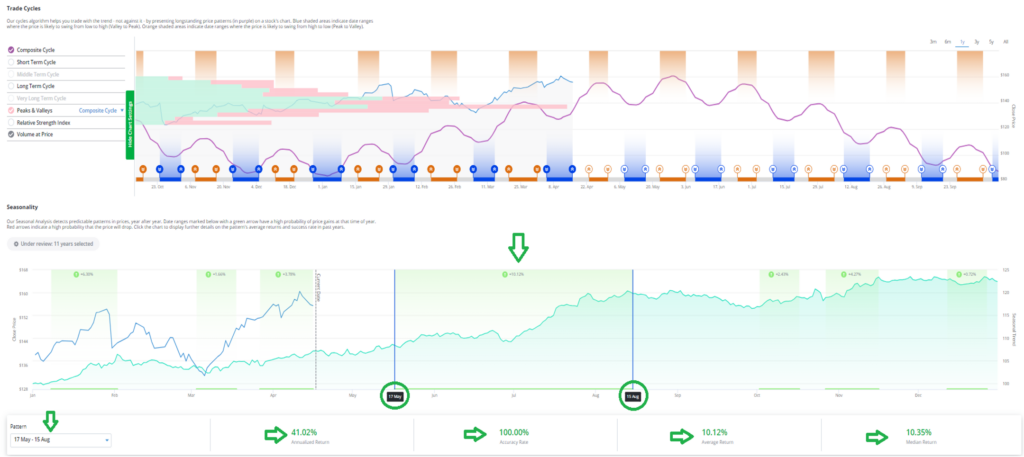
Next you’ll find a Seasonality chart for GOOG. By default, it shows you the most significant seasonal trading windows along the top of the chart, highlighted with an up or down arrow and the average price move (in percent).
It’s a bit hard to see all the details, but GOOG has several profitable trading windows to be aware of. The most lucrative seasonal period is from May 17 to Aug. 15 – you’ll see the details along the bottom and marked with green arrows. Pulling from the 11 years of data under review, here are the vital stats for GOOG:
- 41.02% Annualized Return
- 100% accuracy rate of moving up
- 10.12% Average Return
- 10.35% Median Return
For my money, those make pretty good odds for owners of GOOG shares during this trading window. And now, thanks to our new enhancements, we’ve added yet another new feature.
In addition to the default trading windows, you can adjust the time frame to any period you want.
As you can see below, the October-to-December period includes three trade windows, in October, November, and late December. The average gains are relatively small at 2.43%, 4.27%, and 0.72%, but the consistency of positive gains is high at 80%, 90%, and 80%, respectively.
So, what does the data look like if we string all three of these periods together? Let’s take a closer look.
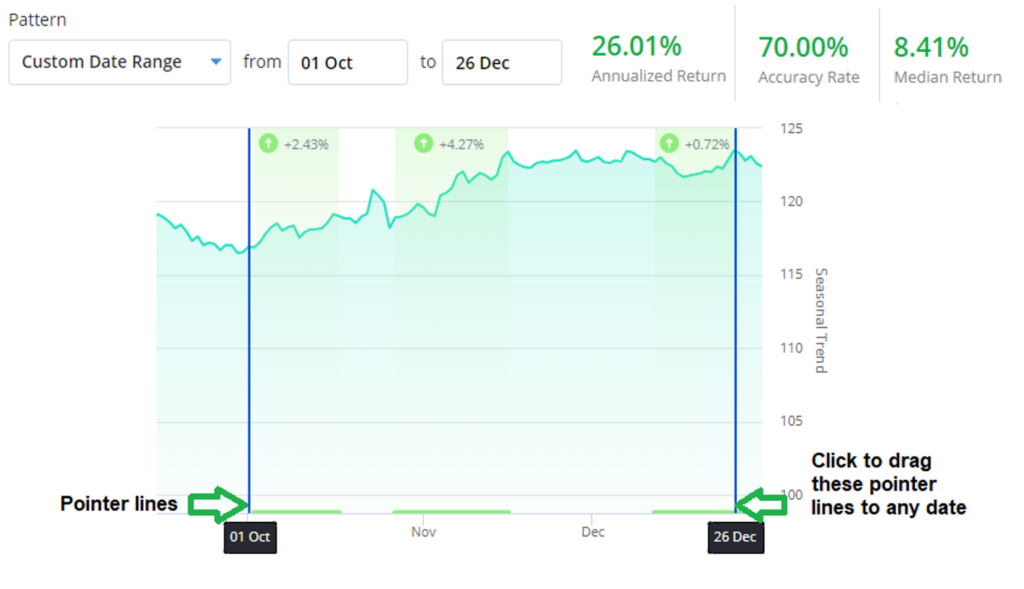
Simply click the blue pointer lines to drag them to any date range you wish. Here I’ve selected Oct. 1 to Dec. 26, which includes three positive trade windows. The result for GOOG, as you can see at top:
- 26.01% Annualized Return
- 70% Accuracy Rate
- 8.41% Median Return
With this simple enhancement, you can analyze any date window on the calendar to help you better time your trade entries, exits, and duration.
Mike Burnick’s Bottom Line: Our TradeSmith Finance tools combined with our market timing cycles are a great way to zero in on the best upside performance windows for stocks, ETFs, indexes, and more. In my next Inside TradeSmith article, I’ll show you how to build stock screens using these powerful tools.
Good investing,

Mike Burnick
Senior Analyst, TradeSmith