How to Screen for the Best Profit Potential in the Next 30 Days
Last week in Inside TradeSmith, I updated you on new enhancements to our Trade Cycles Seasonality tool.
Specifically, our software wizards added the ability for you to analyze any seasonal date window of your choosing for any security. That’s in addition to the most significant seasonal trading windows that show up by default.
For example, if your stock is expected to make its biggest jump of the year between, say, June 16 and July 3, the Seasonality chart will highlight that seasonal window with green shading. But if you want to know what to expect from the stock before June 16, you can plug in a Custom Date Range to find out.
Similarly, when you’re running a stock screener, there are some new, customizable seasonality filters there, too.
Today, I’ll show you how to build a simple screener that can leverage the profit potential of our seasonality indicators even more.
In addition to our Trade Cycles market-timing indicators, another of my favorite indicators is our Business Quality Score. So, in my screener, I’ll combine these two powerful stand-alone indicators. That way, we can uncover high-quality stocks that are also about to enter a bullish seasonal trade cycle within the next 30 days for near-term profit potential.
Keep in mind that the Seasonality tool and filters are available to Trade Cycles subscribers, the Business Quality Score is available to Ratings by TradeSmith and Pro or Lifetime members of TradeStops, and both features are included with TradeSmith Essentials and TradeSmith Platinum.
So, if you don’t see these indicators in your own TradeSmith dashboard — but would like to — simply call 888-623-0858 to find out more.
To get started, log in to TradeSmith Finance and click on Invest from the main menu bar, then on Screener just below it.
Now you should be on the Screener page, which shows several pre-built TradeSmith Screeners, in addition to any you’ve previously saved. Click on + Create new screener, then on + Manage Filters to select additional filters.
Here are the specific filters I chose:
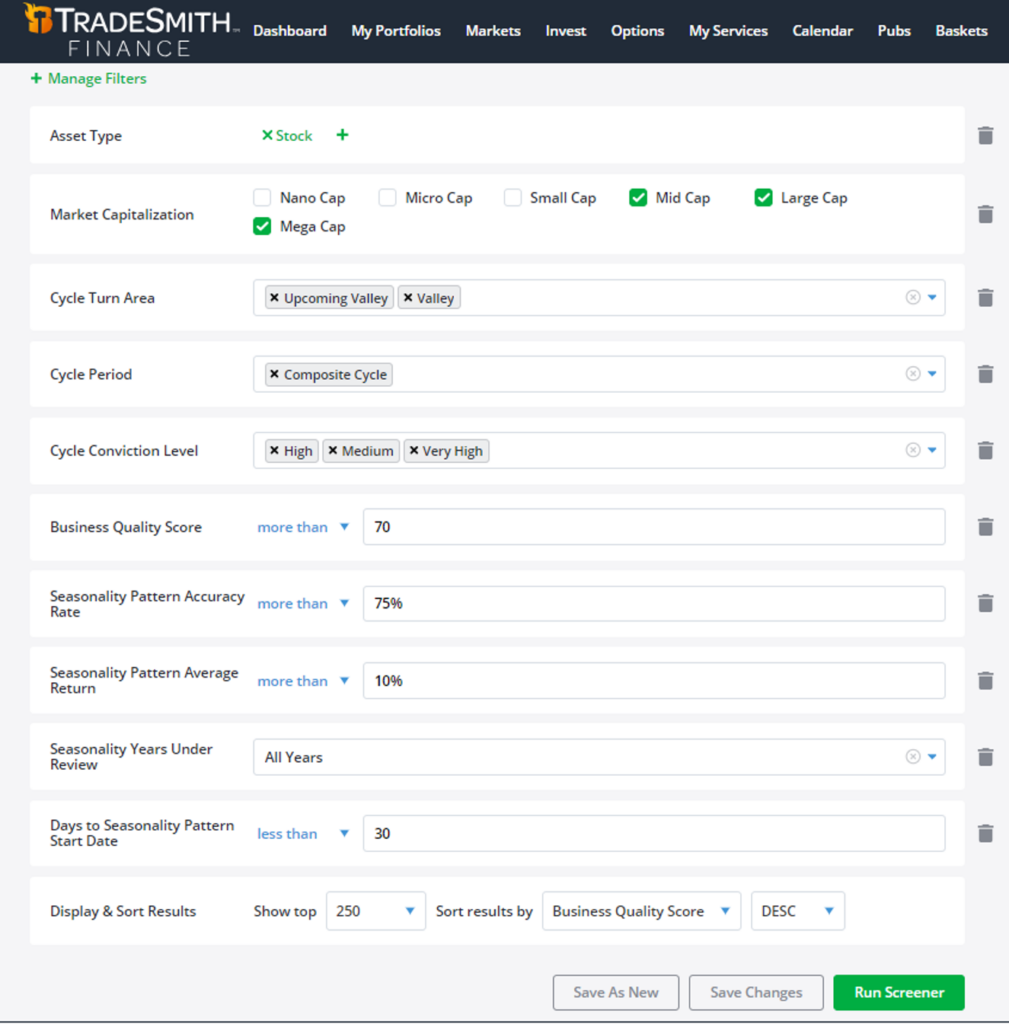
The first two filters are basic: Asset and Market Capitalization. I checked Stocks and only Mid-, Large-, and Mega-Cap, because it stands to reason that larger companies that have been around a while should have built up more reliable seasonal patterns.
Next comes our Trade Cycles filters. I chose Upcoming Valley and Valley for the Cycle Turn Area, and Composite Cycle Period, which is a blend of all our various cycles. For Cycle Conviction, I chose High, Medium, and Very High, to have a greater conviction that the stocks are in or nearing a reliable Valley turn area.
For BQS I chose more than 70. That will return stocks that rank in the top 30% for quality. Keep in mind, you can always adjust this to get greater or fewer results.
Last but certainly not least, we move on to the Seasonality filters. There are several new Seasonality filter choices you can add to any Screener you create:
- Seasonality Years Under Review. Selecting more years can help ensure you’re observing seasonal patterns that are consistent over multiple cycles.
- Days to Seasonality Pattern Start Date.
- Seasonality Pattern Accuracy Rate. For example, “more than 90%” would give you patterns for which 90% (or more) of the selected years have matched the direction: positive or negative.
- Seasonality Pattern Average Return during the selected years, plus
- Seasonality Pattern Annualized Return.
Here are the four Seasonality filters I used in combination along with the setting I chose:
- Pattern Accuracy Rate ❯ 75%
- Pattern Average Return ❯ 10%
- Years Under Review = All Years
- Days to Seasonality Pattern Start Date ❮ 30 days
So, I’m looking for proven seasonal patterns with 75% or more historical accuracy, and an average return per period of 10%-plus. I choose all years under review to cast as wide a net as possible. Then, to zero in on quick potential profits, I selected less than 30 days to pattern start date.
Keep in mind that if a stock has been public only a short period of time, then it will also show up, even if the stock has just five years of data. But you can choose other date ranges of five, 10, 15 years, or just election years, etc.
Next to Display & Sort Results, I selected sort by BQS DESC (descending) to give me the highest-quality stocks at the top. Also, once you’ve gotten your Screener results, be sure to edit your Default View at the top right so that it includes Seasonality Patterns.
Now, as you scan through your list of results, you can click the number link in the Seasonality Patterns column to review the details, like when the pattern starts for that stock, its accuracy rate, and its average return.
When I ran this screen yesterday, I got 19 results. By relaxing or tightening the various filters, you can expand or limit your own results. Since space is limited, here are my top 10 results:
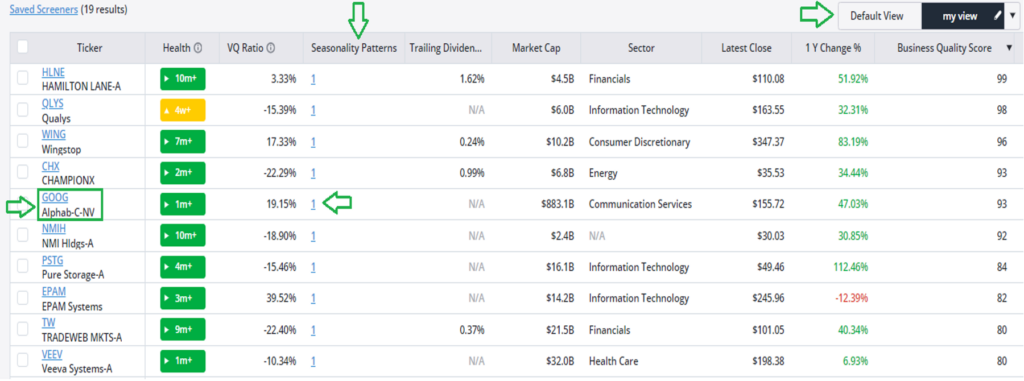
One of the stocks that made the cut is Alphabet (GOOG), the same stock we used as our example in our last article.
So, we simply click the numbered link in the Seasonality Patterns column for GOOG to get the details of the pattern that’s starting soon:
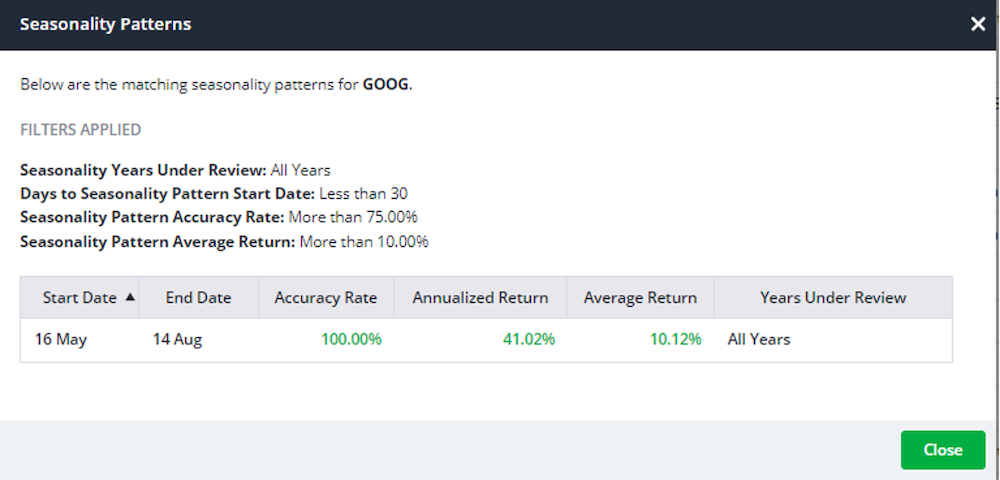
At a glance you can see that GOOG has a lucrative seasonal window open from May 16 to Aug. 14 with the following bullish stats:
- 100% historical accuracy rate
- 41.02% annualized return
- 10.12% average return
That seems like a pretty darn good period to be long GOOG shares.
Mike Burnick’s Bottom Line: Thanks to these new Screener enhancements including Seasonality, it’s easier than ever to find stocks like GOOG that have bullish seasonality trade windows just ahead. Simply set up your favorite Screener with any other filters you desire, then add the Seasonality filters shown above. This will let you scroll quickly through your results to find stocks with a bullish trading window opening soon.
Good investing,
Mike Burnick
Senior Analyst, TradeSmith