Make TradeSmith Analytics Your One-Stop Shop for Monitoring the Markets
The “mad scientists” in our software development team are constantly striving to improve the data, indicators, and tools on our TradeSmith Finance platform.
And they’ve just outdone themselves again, recently adding the TradeSmith Analytics page to our dashboard. If you’re a “quantaholic” like me, then you just can’t get enough interesting data. That means you’re going to absolutely love this feature because it includes so much key stock market data all in one place.
So, if you haven’t visited the TradeSmith Analytics page already, please allow me to give you the cook’s tour in this column so you can get the most out of this new offering. Note that members with TradeSmith Essentials and TradeSmith Platinum will be able to access this dashboard from their platform. (And if you don’t yet have TradeSmith Essentials or TradeSmith Platinum — and would like to — call 888-623-0858 to discuss. Or keep reading below!)
First, log in to TradeSmith Finance, then from the main page, click on Explore TradeSmith Analytics.

That brings you to the Analytics main page in a new web tab. In the left-hand margin, you’ll find the page separated into six sections, as shown below. There is so much intriguing data here, it may be overwhelming at first.
So, let’s go top-down and take a closer look at each section, and I’ll point you to my favorite one.

No. 1 Analytics Data: The first item you’ll find is Analytics Data, which includes powerful insights into new investment ideas. These include:
- Lists of the Most overbought and Most oversold sectors based on Relative Strength Index (RSI). RSI is a key measure of any asset’s price momentum. It tells you if any sectors are overbought (with an RSI reading above 70) or oversold (RSI reading below 30).
Every day we give you a list of the 10 most overbought and oversold sectors. Click on any ticker symbol, and it will take you to that specific Stock Analyzer page for further research. - Scroll down the page and you’ll find a list of top stocks ranked by our Business Quality Score (BQS), one of my favorite TradeSmith indicators. BQS measures a stock’s profitability, growth, safety, and payout. The higher the BQS, the higher the quality of the business – and the stock.
- Next to BQS you’ll see our elite Trinity Stocks list. These represent high-quality companies with stocks that trade at a reasonable price and are in a confirmed uptrend. Quality, value, uptrend: three aces to look for in a great investment.
- Scrolling down a bit further, you’ll find my personal favorite: a list of stocks ranked by Free Cash Flow Yield. Studies have shown that Free Cash Flow Yield is one of the best predictors of “alpha,” or how much a stock outperforms the market.
Free Cash Flow Yield is also an excellent valuation metric similar to – but, in my book, better than – the more popular Price/Earnings ratio. That’s because it goes a bit deeper with a couple of additional factors: It takes a company’s free cash flow (operating cash flow minus capital expenses) over the past 12 months and divides it by the company’s enterprise value (stockholder’s equity plus debt).
Finally, at the end of the Analytics Data, you’ll see stocks that make our Performance Leaders list (shown below) on various time frames:
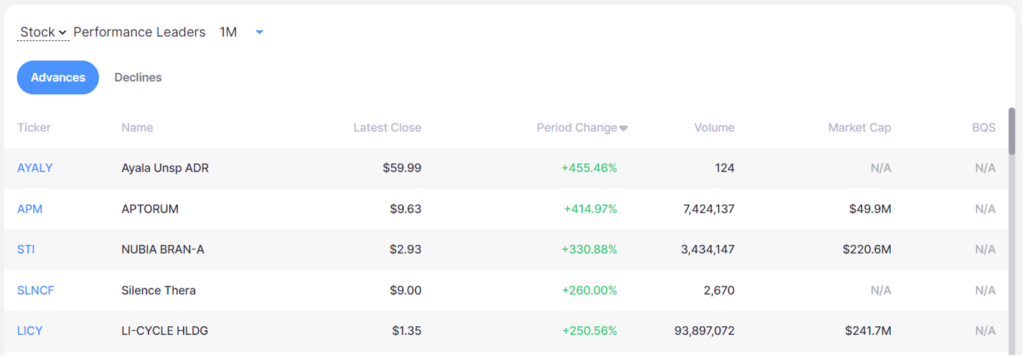
Click on the dropdown menu, and you can sort the list by one-month, six-month, 52-week, or year-to-date performance. This is a valuable indicator of momentum in the stock market that tells you which stocks and sectors are leading the way.
I like to personally use this data to spot shifts in stock-market leadership: finding out-of-favor stocks with poor 52-week momentum that have recently vaulted to the top of the one-month Performance Leaders list.
Again, you can click on the ticker symbol in any of these lists and easily do more homework on each stock that makes the list.
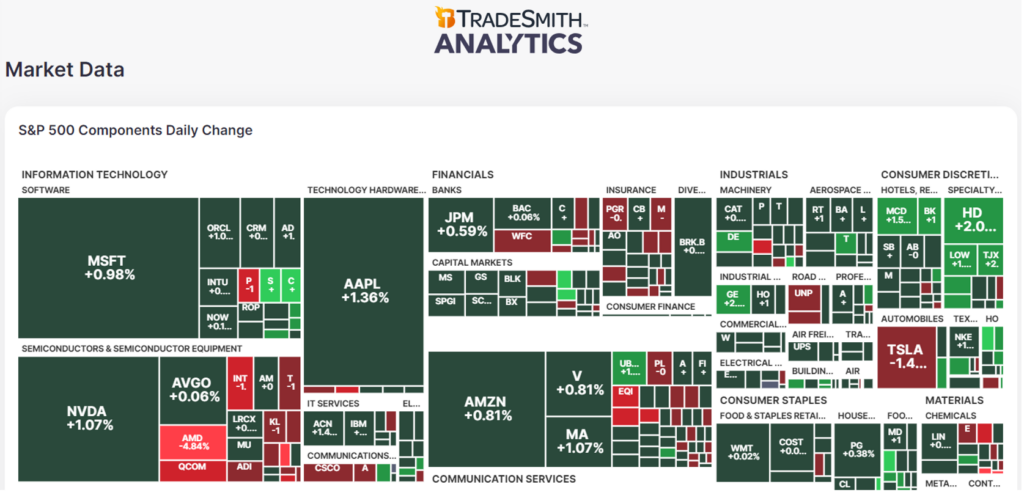
No. 2 Market Data. Next, click on Market Data at the top left, and you’ll find a colorful mosaic of S&P 500 performance by stock and sector. This heat map helps you identify the biggest movers boosting the market or holding it back.
Scroll down further and you’ll find another heat map for overall markets, including the performance of U.S. and leading global market indexes plus a wealth of commodities and currencies. It’s a great way to find what investment assets are hot – and what’s not – in global markets.
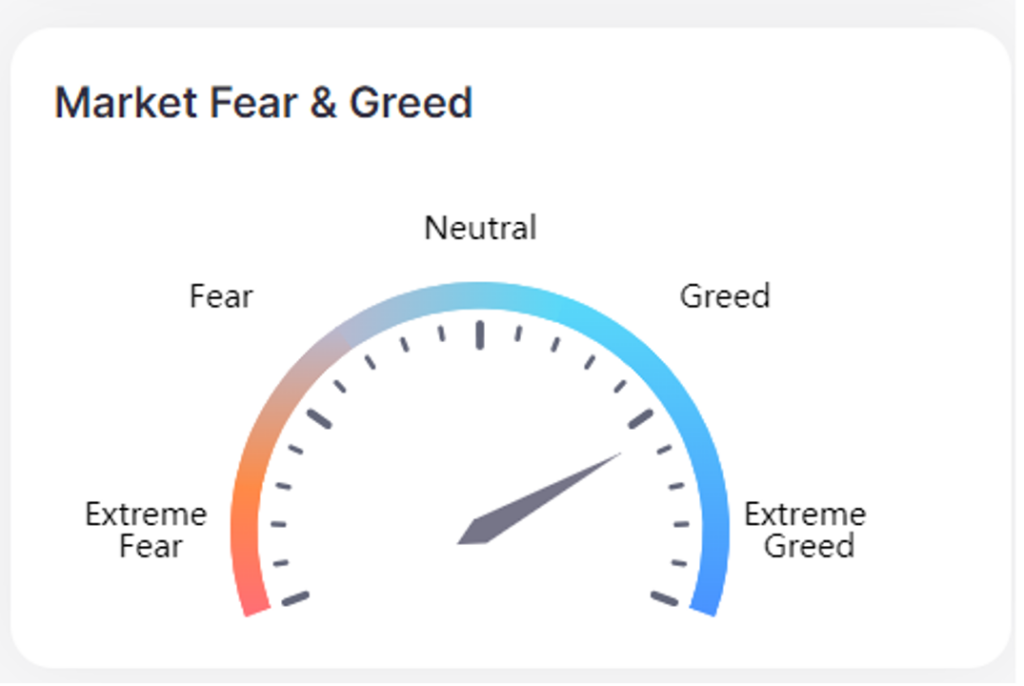
A bit further down this page, you’ll see our Market Fear & Greed barometer. This indicator tells you at a glance if investor sentiment is too bullish (greedy) or too bearish (fearful) so you can better time your own investment allocation.
Finally, at the end of this section, you’ll find S&P Sector Performance and Industry Performance data. Here you can also toggle between one-month, six-month, 52-week, or year-to-date performance. This is a great indicator of which sectors and sub-industries have the strongest price momentum… and which are lagging.
No. 3 Stock Highs and Lows: In this section, you’ll find an expanded list of stocks making new highs or new lows. The default is 52 weeks, but once again, you can sort this list by one-month, six-month, 52-week, or year-to-date.
This gives you insight at a glance into the stocks hitting new highs or falling to new lows over various time frames.
No. 4 Insider Trading: Here you’ll find a comprehensive list of stocks and trades by insiders, shown below.
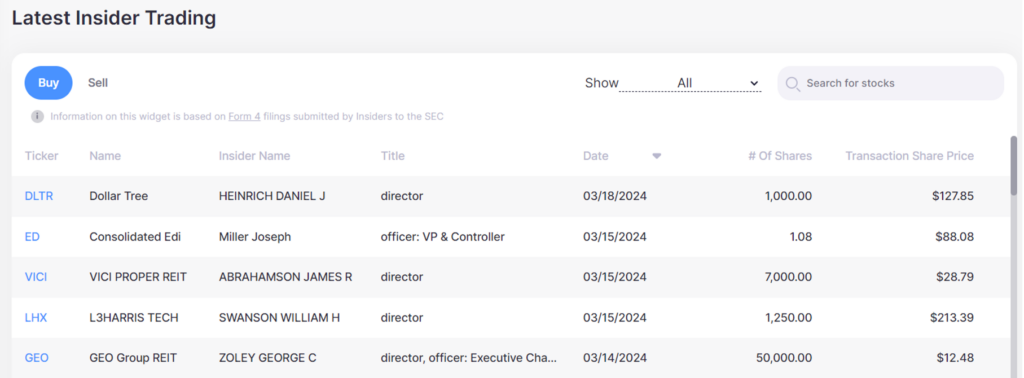
This is based on recent Form 4 filings that insiders are required to submit to the SEC. The data includes the name and title of the insider, along with transaction date, the number of shares bought or sold, and the price.
No. 5 Earnings Calendar: This is a great feature that can keep you on top of upcoming earnings announcements from your favorite stocks. It lists earnings for the next week in advance, grouped by day, so you can take note of upcoming reports. Plus, you can use the Search for stocks feature to find financial-report dates for specific stocks you may be researching.
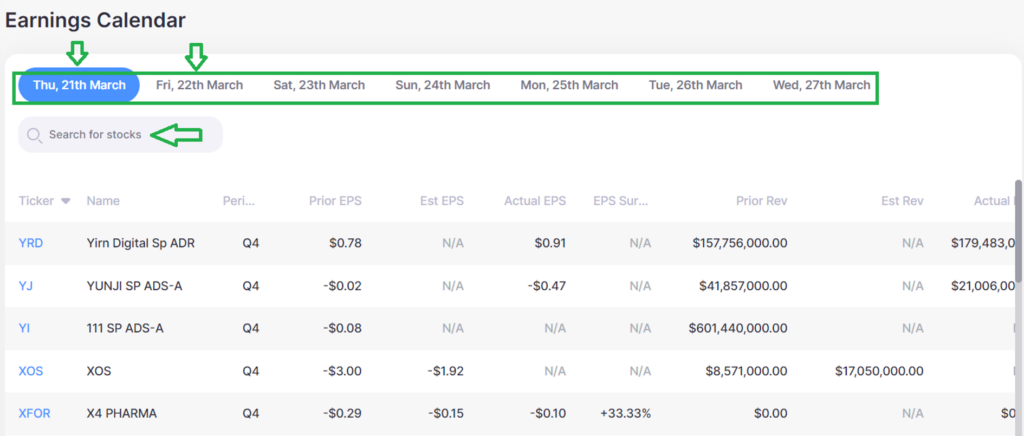
The earnings per share (EPS) data includes the prior-period reported EPS compared to current analyst estimates (Est) and the actual results, if already released, plus estimated revenues (Est Rev) and actual revenue results.
No. 6 News: We’ve collected and posted news you can use from a wide variety of sources: the Associated Press, Business Insider, CNBC, The Wall Street Journal, and many more.
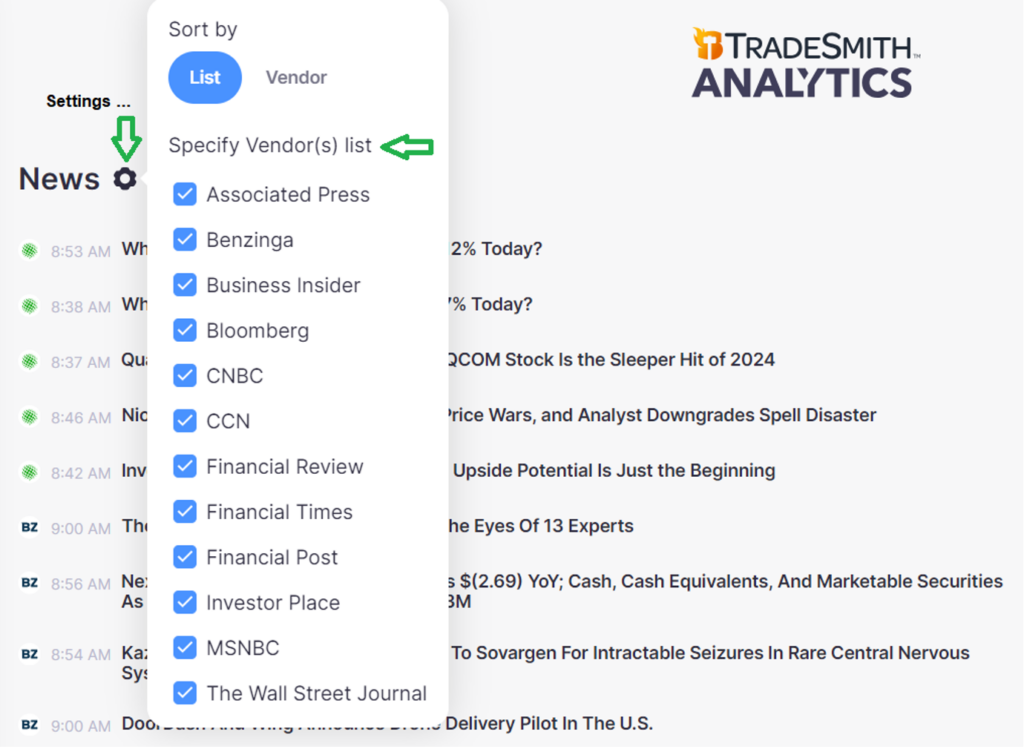
In this part of the Analytics dashboard, you’ll get a feed of general news on markets and for individual stocks. Plus, you can filter by source in the settings menu, as shown above, and select only those you prefer.
Mike Burnick’s Bottom Line: Our new TradeSmith Analytics page is a powerful addition to our popular Dashboard feature. As a TradeSmith Essentials or TradeSmith Platinum member, you get any and all of our newsletters and tools, and you can visit TradeSmith Analytics every single day to generate new investment ideas from our lists, keep tabs on the top-performing stocks and sectors, watch market trends, follow market-moving news, and keep track of insider buying and upcoming earnings. I find it to be an incredibly convenient, one-stop shop to start your investing day.
Good investing,

Mike Burnick
Senior Analyst, TradeSmith