What to Watch For in the S&P After Last Week’s Ugly Drop
Last week was ugly for stocks, no doubt about it. And I’ve seen several questions from TradeSmith members about what’s happening in the stock market.
So, I’ll use today’s column to share my views, backed up by the hard data you’ll find in our TradeSmith market indicators.
Just to recap, the S&P 500 dropped 1.5% last week, and in the process ended the week right on top of key support near its 50-day moving average, around 5,115.
Also, internal market breadth was horrendous last week, with two 80-plus downside days – in which 80% of stocks declined and 80% of trading volume was to the downside:
- The first was Wednesday, after a hotter-than-expected Consumer Price Index (CPI) report for March, which dimmed the prospect of interest-rate cuts even more.
- The second 80%-plus down day came, inauspiciously, on Friday. The S&P closed both the day and the full trading week right on its lows.
Plus, out of the 89 industry groups I track, only eight managed a gain of any kind last week, while one was flat and the other 80 were all in the red. Not a great showing.
After the strong rally stocks experienced since last year’s October low, it would not be surprising to see a deeper pullback develop. So, what are the key levels to watch? I’m glad you asked.
In the TradeSmith Finance chart of the S&P 500 below, you can see a couple key support levels I’m watching closely:
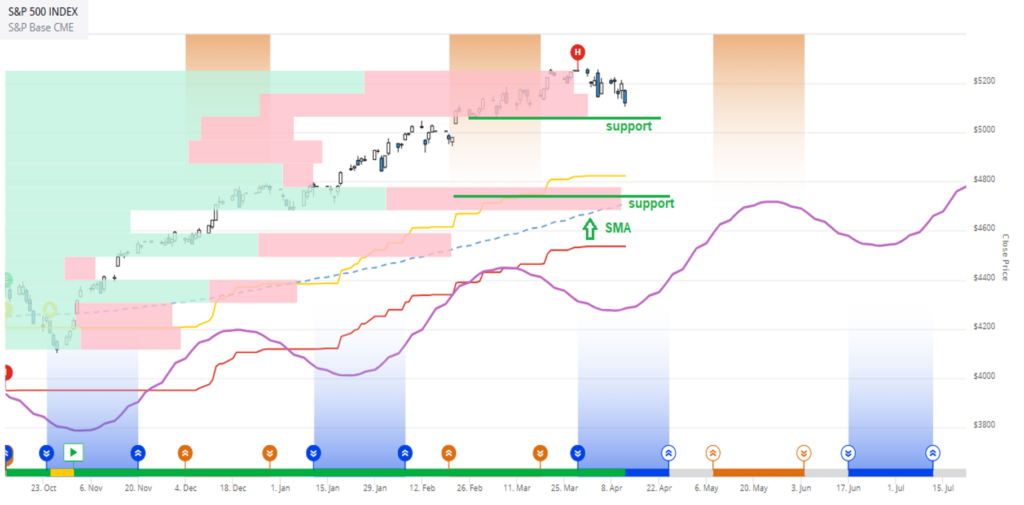
The first is marked with a green line that rests right at the lower end of the horizonal Volume at Price (VAP) bars, at roughly 5,050 to 5,100 for the S&P.
If you’re not familiar with this indicator, VAP bars show how much trading volume has taken place at various price levels in the past. The wider the VAP bar is, the more heavily traded these levels have been, so the more likely they’ll act as key support for the stock (or index) price going forward. And when price breaks below these levels, that level becomes resistance to any rally attempt.
The blue-chip index is trying to dig in and hold this level now, but if it gives way, it could open the door to a steeper pullback.
The second green support line is also drawn in line with a substantial VAP bar centered around 4,750 for the S&P 500. Notice also that this price level lines up nicely with our Smart Moving Average for the S&P, which is currently 4,711, but is rising about four to five points per day.
Lastly on the chart are the orange and blue shaded areas from our Trade Cycles algorithm, one of the signals that features heavily in TradeSmith CEO Keith Kaplan’s briefing on Thursday.
From a Trade Cycles perspective, the S&P 500 is about to exit a valley area on April 25 and head into a peak starting in early May, which continues to early June. These peaks can be a vulnerable time frame, when our timing cycles have found that prices tend to reverse lower from there.
Notice also that the overall trend in the composite cycle (purple line in the chart above) continues upward through late September, even with a few dips along the way. The next peak after May comes in August. But the overall trend moves higher into year-end. And that’s welcome good news.
Now, let’s dive a bit deeper into our TradeSmith internal market breadth indicators to see what’s going on under the hood. The ones I’m about to show you are available to members of Ideas by TradeSmith, as well as members of Trade360, TradeSmith Essentials, and TradeSmith Platinum. (And if you don’t see these indicators in your TradeSmith Finance dashboard — and would like to — call 888-623-0858 to discuss.)
If you’re a subscriber, you can access the below chart by clicking on Markets, Market Outlook, and then S&P 500 (SPX). This defaults to the Holdings tab for the index, which gives you a snapshot of the Health, Stock Rating, and Trend distributions. Currently, it’s showing 64.53% of S&P stocks in the Health Indicator Green Zone. Now, just below the distribution widget, click on More Details to bring up the chart below:
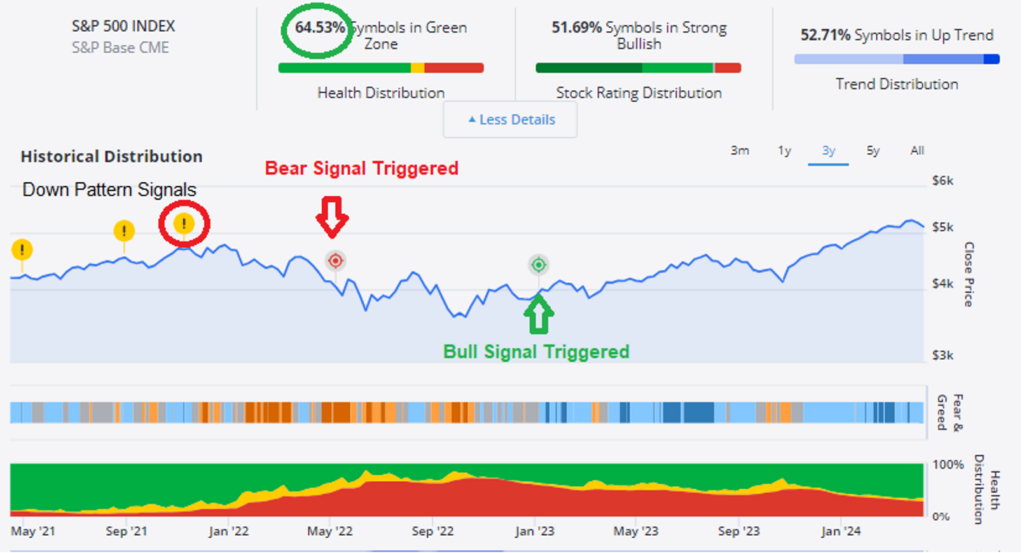
The Health Distribution just below the chart itself jumps out at me because it has yet to even start deteriorating. With about 65% of SPX stocks still in the Green Zone, that’s a bullish sign, and here’s why…
If you glance back to late 2023, the last time the S&P had a significant pullback, you’ll see that stocks in the Green Zone did fall from about 53% in early August to about 28% at the end of October.
But most of these stocks only pulled back into the Yellow Zone, which increased from 4% to 21% during the same period. Few stocks slipped into the Red Zone during that market pullback. In fact, it ticked up to 51% from 42%, a relatively minor increase of just nine percentage points.
That’s a textbook example of an ordinary and orderly stock-market correction. Most stocks (49%, to be exact) remained in a healthy state in the Green or Yellow zones.
And many of those Yellow Zone stocks turned out to be wonderful buy-the-dip opportunities when the market trend resumed higher in November 2023.
Also note in the chart that (so far, at least) none of our cautionary signals have triggered as they did in late 2021, when you see the down-pattern signals marked by a round yellow icon. And more importantly, no Bear Signals have triggered, as one did early in 2022. In fact, the last Bull Signal triggered in January 2023, giving us the all-clear signal for the S&P.
On the Markets page you can review the historical distribution of all the other major stock indexes (Dow, Nasdaq, Russell 2000, and others) and see that all (except Hong Kong) triggered Bull Signals around a year ago.
Mike Burnick’s Bottom Line: Corrections of 10% are perfectly normal to experience without triggering deeper sell signals for the stock market. Keep a watchful eye on the TradeSmith Finance Markets page so you can frequently review the health of the markets. Be on the lookout especially for a sharp rise in the percentage of Red Zone stocks, any down-pattern or Bear signals, and invest accordingly.
Good investing,
Mike Burnick
Senior Analyst, TradeSmith