A Funeral for the Bears
When there’s zero reason for stocks to rise… start buying.
That’s one of the most valuable mantras I learned working on Wall Street. As soon as everyone’s thrown in the towel, then and only then can a new uptrend emerge.
That’s exactly the setup investors face today. We’ve reached extreme oversold conditions. History points to a massive rally around the corner.
This isn’t a “gut feel” thing. I have proof.
That proof is the Big Money Index (BMI). It’s a real-time indicator of institutional appetite for stocks.
History shows that when institutional money flows into stocks, they rise. When that money exits, stocks collapse.
However, there are rare tipping points when selling pressure is so immense, it triggers a violent rally. From what I’m seeing, we’re on the precipice of one of those rallies.
Bears have had a great end to the summer, their jowls bloody with prey…
But it’s time for them to crawl into their caves and start a long hibernation.
I’m as bullish as I’ve been all year long. And today, I’ll show why you should be, too.
Notice how it oscillates moving higher and lower within upper and lower bands (red and green dashed horizontal lines).

As this happened, markets came under pressure. But now the selling has gotten too intense, signaling a climax… and a bottom.
You know how just before a massive tsunami hits, the tide goes out further and further? This is just like that.
The tide of institutional capital has gone far out to sea… but it’s about to come flooding back in spectacular fashion.
But the last time we saw conditions like this was mid-October 2022. Just as everyone gave up, the market began its march higher… to the disbelief of the crowd.
I believe the same setup is here today.
The BMI is constructed on a 25-day moving average of the total number of buy and sell signals for individual stocks. The green zone, where we are today, represents a buy ratio of 25%. That means over the past five weeks, there’ve been four sell signals for every buy signal.
To give you perspective on the magnitude of selling we’re witnessing, here’s a view of buys and sells broken out by market cap since September:
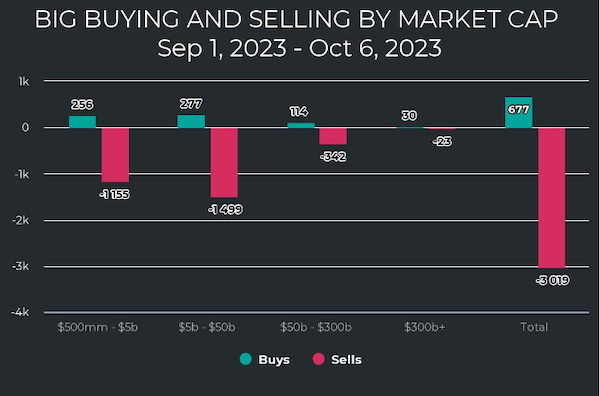
That’s a ton of red! Incredibly, companies with market caps below $50B saw 533 buy signals vs. 2,654 sell signals. That’s roughly 8 sells for every buy.
Like I said earlier, we only see conditions like this during extreme risk-off periods.
I’m talking about events like:
History shows that you want to be scooping up stocks with both hands in times like this.
On average going back to 1990, one month after we get an oversold signal on the BMI, the S&P 500 gains 3.6%.
Six months later, markets rip 9.1%.
After a year, stocks cruise 15.1% higher:

R.I.P. bears!
Look, I’ve been pounding the table for over a month to get ready for a powerful rally. It’s in these fear-driven moments when explosive up moves begin.
Don’t buy into the fearful media playbook. Just buy amazing stocks at amazing prices!
That’s one of the most valuable mantras I learned working on Wall Street. As soon as everyone’s thrown in the towel, then and only then can a new uptrend emerge.
That’s exactly the setup investors face today. We’ve reached extreme oversold conditions. History points to a massive rally around the corner.
This isn’t a “gut feel” thing. I have proof.
That proof is the Big Money Index (BMI). It’s a real-time indicator of institutional appetite for stocks.
History shows that when institutional money flows into stocks, they rise. When that money exits, stocks collapse.
However, there are rare tipping points when selling pressure is so immense, it triggers a violent rally. From what I’m seeing, we’re on the precipice of one of those rallies.
Bears have had a great end to the summer, their jowls bloody with prey…
But it’s time for them to crawl into their caves and start a long hibernation.
I’m as bullish as I’ve been all year long. And today, I’ll show why you should be, too.
A Big Money Tsunami
Below is a 1-year chart of the BMI. The yellow line is a moving average of individual stocks getting bought and sold.Notice how it oscillates moving higher and lower within upper and lower bands (red and green dashed horizontal lines).

As this happened, markets came under pressure. But now the selling has gotten too intense, signaling a climax… and a bottom.
You know how just before a massive tsunami hits, the tide goes out further and further? This is just like that.
The tide of institutional capital has gone far out to sea… but it’s about to come flooding back in spectacular fashion.
Best Time to Buy Since October ‘22
It may not feel like a great time to buy stocks right now.But the last time we saw conditions like this was mid-October 2022. Just as everyone gave up, the market began its march higher… to the disbelief of the crowd.
I believe the same setup is here today.
The BMI is constructed on a 25-day moving average of the total number of buy and sell signals for individual stocks. The green zone, where we are today, represents a buy ratio of 25%. That means over the past five weeks, there’ve been four sell signals for every buy signal.
To give you perspective on the magnitude of selling we’re witnessing, here’s a view of buys and sells broken out by market cap since September:
That’s a ton of red! Incredibly, companies with market caps below $50B saw 533 buy signals vs. 2,654 sell signals. That’s roughly 8 sells for every buy.
Like I said earlier, we only see conditions like this during extreme risk-off periods.
I’m talking about events like:
- The high-inflation bear market of 2022
- The COVID-19 crash
- The 2018 Fed rate hikes
History shows that you want to be scooping up stocks with both hands in times like this.
On average going back to 1990, one month after we get an oversold signal on the BMI, the S&P 500 gains 3.6%.
Six months later, markets rip 9.1%.
After a year, stocks cruise 15.1% higher:

R.I.P. bears!
Look, I’ve been pounding the table for over a month to get ready for a powerful rally. It’s in these fear-driven moments when explosive up moves begin.
Don’t buy into the fearful media playbook. Just buy amazing stocks at amazing prices!