Bayesian Priors and the Trouble with Antibody Tests
On the COVID-19 medical front, the hot new thing is antibody tests.
The idea is that, if a person tests positive for antibodies, it would show they have already contracted COVID-19. That would imply (though not guarantee) they are safe from getting infected again.
Antibody tests could also indicate the overall percentage of a population that has already had COVID-19.
In the state of New York, for example, 21% of New York City residents may have been infected (as reported by the New York Times).
Because the COVID-19 caseload was highly concentrated in New York City — one of the most densely populated urban centers in the country — it drops off quickly for surrounding areas. Numbers for Long Island suggest the antibody rate was 17%; for Westchester and Rockland counties it was 12%; and the overall rate was 4% for the rest of New York state.
These antibody tests have a big drawback, though. For most of the antibody tests in circulation, which vary widely in origin and quality, the accuracy is terrible. This renders them useless, or even dangerous.
To show why accuracy is so important, let’s walk through a quick probability exercise.
- Imagine the actual rate of COVID-19 cases in your area is 4%, meaning that 4 out of every 100 people in your city or county have actually been infected.
- You take an antibody test with a 96% accuracy rate and a 4% false-positive rate. Lab work has shown that, 4% of the time, this test returns a “false positive” diagnosis (identifying antibodies where they don’t exist).
- Your test results come back positive.
- Given what you know about the actual rate of infection in your area — and the 96% accuracy rate of the test — what is the actual probability you have antibodies (and already had COVID-19)?
Most people would assume something like this: “The test is shown to be 96% accurate. That means a 96% chance I have antibodies and have already had COVID-19.”
But that answer is wrong. The correct answer is 50%.
Given the data provided, the odds of having COVID-19 antibodies are coin-flip. Even with a 96% accuracy rate, the test has told you nothing much at all.
Even worse, it may have created false confidence by supporting the notion you already had the virus and are safe (when the real chance of this is just 50/50).
To understand why this is so, we have to start with the prior probability distribution, a concept known as the “”prior” or “Bayesian prior.”
We explained that, in reality, 4% of the local population, or 4 people out of 100, had actual antibodies. We can represent that percentage with a 10×10 grid as shown below.
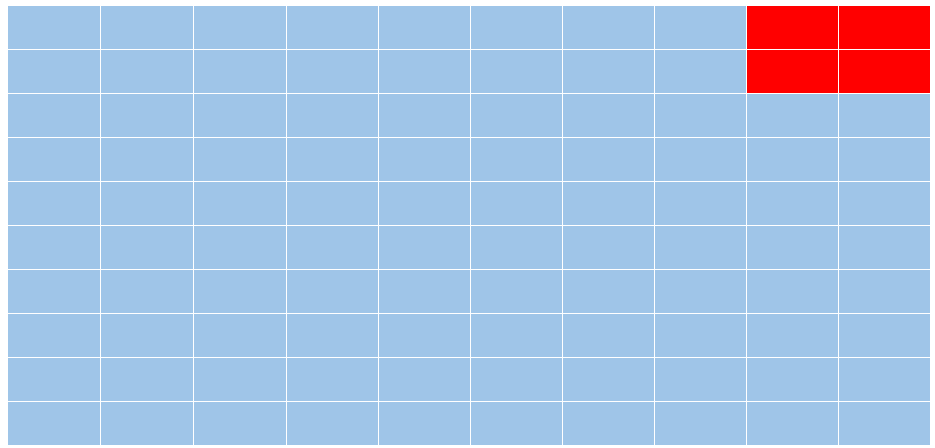
In our grid example, the 96 blue squares represent people with no antibodies. The four red squares are the people who do have antibodies, representing 4% of the population.
Now let’s show the results of the antibody test.
Remember we stipulated that the test has a 96% accuracy rate and a 4% false positive rate. The grid below represents what it would look if this test were given to the same population of 100 people, where 4% actually do have antibodies.
The red squares with a “T” represent “True” positive results. The orange squares with an “F” represent “False” positive results — the 4% of the time where the test gets it wrong.
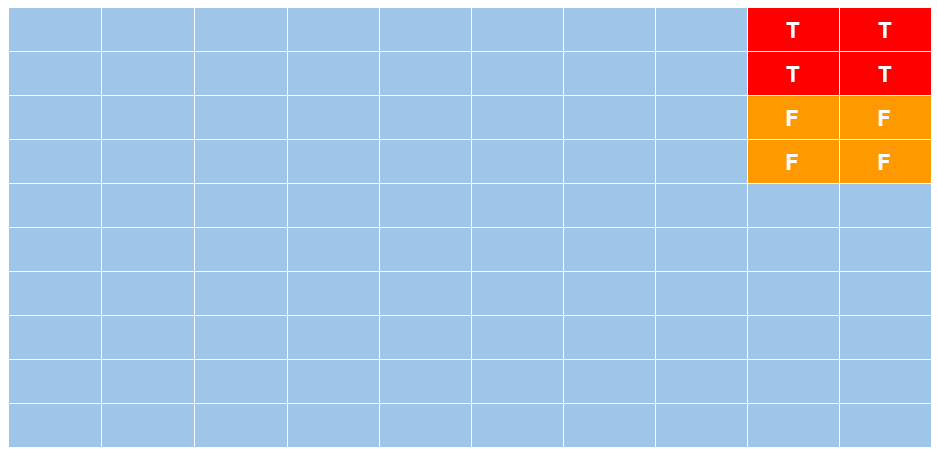
As the visual implies, anybody who tests positive cannot know if they occupy a red square (true result) or an orange square (false positive result).
What’s more, the number of red squares and orange squares are equal, which shows why a test with 96% accuracy can deliver a 50% verdict (no better than a coin flip). The test reliably identifies the four true positives, but also identifies four false ones. Hence, if your results come back positive, the odds of being red (true) are 4/8; but the odds of being orange (false) are also 4/8.
A quicker, though less intuitive, way to explain what is happening here is to point out that the prior probability distribution (the Bayesian prior) and the testing error rate have a mathematical relationship. The smaller the first number in comparison to the second, the more useless the test result becomes.
This also matters a great deal when it comes to assuming the rate of antibodies (and thus COVID-19 cases) within a general population.
Say, for example, an antibody test assumes a 5% antibody rate within a population but the test is only 90% accurate. One might think “90%, that’s pretty good” — but if the error percentage (10%) is double the output percentage (5%), the test is worse than useless (in terms of providing false confidence).
A team of more than 50 scientists from University of California San Francisco, University of California Berkeley, the Chan Zuckerberg Biohub, and the Innovative Genomics Institute recently tested the accuracy of 14 different COVID-19 antibody tests. Their initiative is called the COVID-19 Testing Project.)
“Of the 14 tests, only three delivered consistently reliable results,” the New York Times reports. “Even the best had some flaws.”
In consistency terms, three out of 14 is a terrible hit rate.
As for the others — they are worse than useless, per the New York Times again: “Four of the tests produced false-positive rates ranging from 11% to 16%; many of the rest hovered around 5%.”
These are not numbers to be trusted.
Hopefully the quality of these antibody tests will improve dramatically before they are rolled out at scale — and especially if the test results are used to shape policy decisions.
As it stands, far too many of these tests could deliver dangerous misinformation: Imagine taking a test with a touted 95% accuracy rate, assuming you are safe (because you already had COVID-19), and then finding out the tragic way you were wrong.