Despite Strong Momentum, What Are the Odds of a September Slump?
|
Listen to this post
|
The month of September started in positive territory during the first three trading days.
Is it time to pop the champagne bottles?
Thanks to a sudden shift in market momentum, investors have poured additional capital into the market over the last week. More than 60% of all stocks traded below their 50-day simple moving average two weeks ago. On Friday (Sept. 3), that figure fell to 40%, according to Finviz.
This is a big move in sentiment in a brief period.
What happened? Today, I’m going to outline three major factors driving higher sentiment. However, I want to make one thing very clear before I do so. Historically, September is the weakest month for the financial markets. This means that despite the positive sentiment, we could experience a sharp reversal.
Let’s dive into the macro trends to start our week.
The Fed Makes a Statement
In mid-August, investors anticipated that the Federal Reserve would start the process of tapering its $9 trillion balance sheet as soon as the upcoming Federal Open Market Committee meeting later this month. However, after the Fed’s annual symposium in Jackson Hole, Wyoming, Federal Reserve Chair Jerome Powell announced that the central bank still had much work to do.
This announcement helped propel capital back into the S&P 500 quickly. Despite the geopolitical concerns linked to Afghanistan, markets quickly accelerated. The Fed might make a few announcements about its plans to wind down its monthly $120 billion in Treasuries and mortgage-backed securities at the September meeting.
However, an aggressive plan to taper may be off the table based on Friday’s jobs report and concerns about economic growth. Instead, the expectation is that the Fed may start its process by cutting $10 billion per month come December. But there may be more flexibility by the central bank.
Remember, every delay in the Fed’s tapering, or even a smaller cut to its purchases than expected, will prolong the push of fresh capital into the economy. Moreover, given the relationship between the Fed’s balance sheet and the S&P 500, there appears to be more upside.
A Psychological Level Finds Support
The market has an unusual psychological trend. The recent run toward 4,500 for the S&P 500 was a critical test of sentiment and resistance. Almost immediately after the S&P 500 reached that level on Aug. 27, investment banks started raising their targets for the year ahead. UBS projected recently that the index would hit 5,000 by the end of 2022.
That 4,500 level did more than just instill confidence in a future run for the market.
Volumes picked up rather quickly. According to FactSet, the number of shares traded each day on the SPDR S&P 500 ETF (SPY) totaled roughly 54 million during the final week of August. Mid-month, that figure was less than 50 million shares traded.
We also witnessed a wave of capital pour back into the more than 8,000 stocks trading in the markets. For example, the iShares Russell 2000 ETF (IWM) traded sideways from March until August.
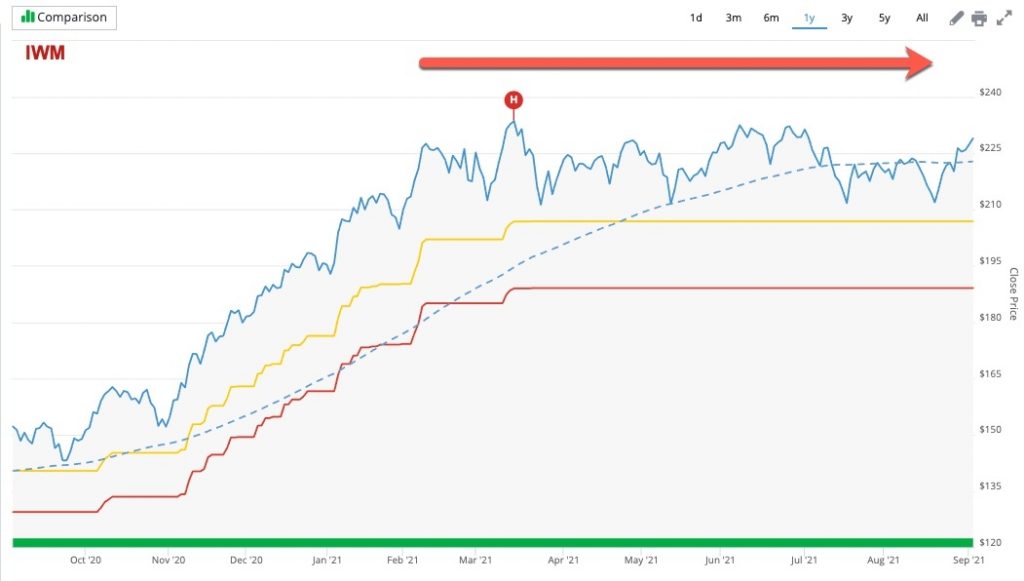
This index represents 2,000 companies that fall in the small-cap space. The sideways trend resulted from negative momentum trends that fueled capital out of value stocks and small-cap stocks and into larger-cap stocks.
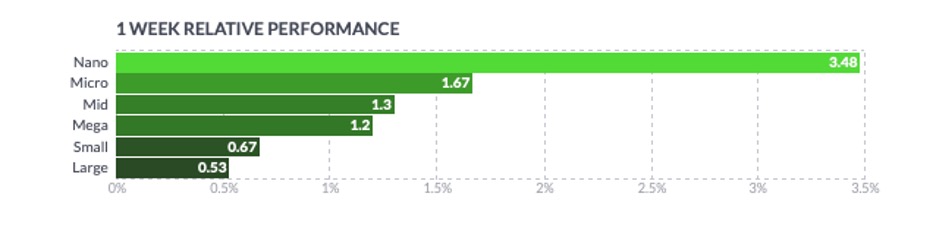
But the recent turn in market momentum has fueled a wave of capital back into small-cap, nano-cap, and micro-cap stocks. As you can see in the Finviz chart below, these stock classes (by market capitalization) had an excellent week to start the month of September.
Washington Remains Paralyzed
The final factor that continues to fuel strong volumes is the paralysis in Washington. Domestic policy has effectively hit a wall in Washington. While a smaller infrastructure package moved through the Senate, the likelihood of bipartisan cooperation on a broad bill is fleeting. The deeper we move into 2021, the closer we move toward next year’s midterm elections.
With the Senate split 50-50 and the Democrats only holding the House of Representatives by two handfuls of votes, a radical policy shift that would affect the economy or the stock market looks to be off the table. An overhaul of the tax code or massive tax hikes are unlikely to occur in the months ahead (or at least until 2024 at the earliest).
With no policy surprises on the horizon and the Democrats holding enough votes to increase the debt ceiling, investors have fewer worries about the year ahead.
Keep an Eye on the Past
Despite the positive upswing to start the month, we always remain vigilant about today’s market. As I’ve noted, valuations are stretched, utility closed-end funds were recently trading higher than their net asset value, and other factors indicate a frothy market.
In addition, September is historically the worst month for the stock market. Since 1928, the month has produced an average return of -0.1%. Meanwhile, it has experienced a win rate of just 46% in that same time frame. Given this historical factor, investors will still be anxious about a downturn later this month, regardless of recent positive catalysts.
Should the market experience a significant pullback, I’m promising to notify all my readers when our system triggers the next “Bearseye Signal,” indicating a move to the Red Zone for any of the 11 major indexes we follow within TradeSmith Finance. I want all of our readers to be prepared when the next bear market begins, regardless of subscription status.
I’ll be back soon to discuss the cryptocurrency warning from a major hedge fund manager. But, more importantly, if you’re curious about Bitcoin or other digital currencies, I’ll show you how to manage your risk and choose which ones to purchase.