A New Year, a New Decade, and It’s Time to Get Back to the Basics
Quick question, and answer honestly: Do you have an exit strategy in place for each of your stocks? Hold that answer for a moment.
In just a few hours, the calendar will turn over, and we’ll be in a new year and a new decade. One year ago, we were coming off the worst Christmas Eve performance in history and today, we’re sitting at the end of the year with a powerful rally that nobody saw coming.
Bull markets and rallies like the one we had this year are great; we all make money, all of our accounts move higher, and we feel incredibly smart. These types of markets feel like they’ll never end, and it’s easy to become complacent.
But complacency is the enemy of investors. Why? When the markets turn down (and they will turn down again), the emotions of the downturn can cause us to make mistakes and either get out of our stocks too early or hold them too long.
And how do we position ourselves so we don’t get out too early or hold them too long? With the TradeStops risk management system! We help you understand the risk you’re taking in each of your positions and when the best time is to get out of those positions.
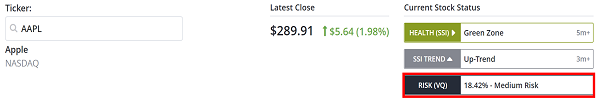
The heart of the TradeStops system is called the Volatility Quotient, or VQ for short. The VQ is measured as a percentage of a stock’s week-ending closing price. For instance, the VQ of Apple Inc. (AAPL) on 12/20/2019 was 18.42%.
 |
The algorithm used to determine the VQ of any stock is proprietary to TradeStops. The purpose of the VQ is to know what the normal volatility is of any stock, fund, or index over an 18-month time frame. We use three years’ worth of data, with the past year being more heavily weighted than the previous two years’ worth of data.
When we say that AAPL has a VQ of 18.42%, we’re saying that the normal volatility of AAPL is $53.40, which is the most recent close ($289.91) multiplied by 18.42%. This is not a prediction of future price movement. This is strictly a measurement of the normal volatility for AAPL.
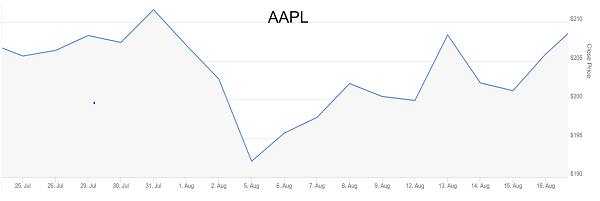
Stocks don’t move up in a straight line, and they don’t move down in a straight line. Here’s a four-week view of AAPL from earlier in the year. The high at the end of July was $211.60, which was followed just a few days later by a drop down to $192.03. That’s a drop of almost 20 points in just a couple of trading days.
 |
If you had bought AAPL at the top, and didn’t know its VQ at the time, you could have easily been scared and sold it.
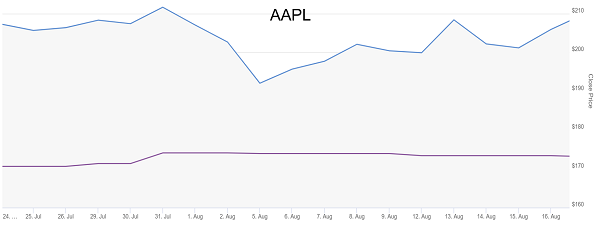
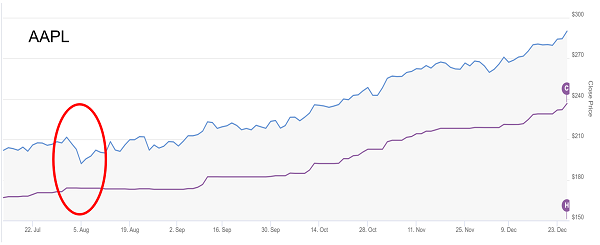
But what if you had seen the TradeStops view of AAPL that shows its normal volatility in this chart? The purple line below shows a trailing stop equal to the VQ of AAPL.
 |
You’d see that AAPL was well within its level of normal volatility and wouldn’t have been scared away from the stock. And you would have reaped the rewards from your knowledge as AAPL stock has moved higher by almost 100 points in the past five months! And the stop loss now sits at $236.50.
 |
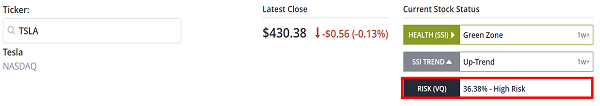
For reference purposes, Tesla (TSLA) is more volatile than AAPL, but do you know by how much?
The VQ for TSLA is almost exactly double that of AAPL. It has a VQ of 36.38%. That means if you buy TSLA, you have to be comfortable with it potentially moving against you by 36% and understanding it’s still in an uptrend.
 |
If your risk tolerance is such that you can’t or don’t want to withstand a 36% loss or even more, then TSLA is probably not a stock you should consider for your investment portfolios.
Most all of the tools found on TradeStops have their origin in the Volatility Quotient. During our next “Back to Basics” article, we’ll show you how the Stock State Indicator (SSI) signals were developed using the VQ as its basis. We’ll also show you how the SSI can be used as simple green/yellow/red signals for your entire stock management.