Publicly Held Debt-to-GDP Made Headlines This Week, But Another Chart Matters More
The U.S. national debt made headlines this week, with federal debt held by the public expected to be worth more than 100% of gross domestic product (GDP) next year. This hasn’t happened since the mid-1940s, in the aftermath of World War II.
According to new analysis from the nonpartisan Congressional Budget Office (CBO), the total amount of U.S. federal debt held by the public will amount to 98% of gross domestic product (GDP) for the 2020 fiscal year, and exceed 100% for the fiscal year beginning on Oct. 1.
We were amused by the financial media headlines and articles reporting the CBO’s findings. The prospect of returning to World War II debt levels carried a whiff of shock and surprise.
And yet, this development hardly arose from nowhere. America has been adding to its dizzying debt pile for years, if not decades. Returning to World War II levels has long felt inevitable.
Then, too, our preferred measure of debt-to-GDP crossed the 100% threshold a while ago.
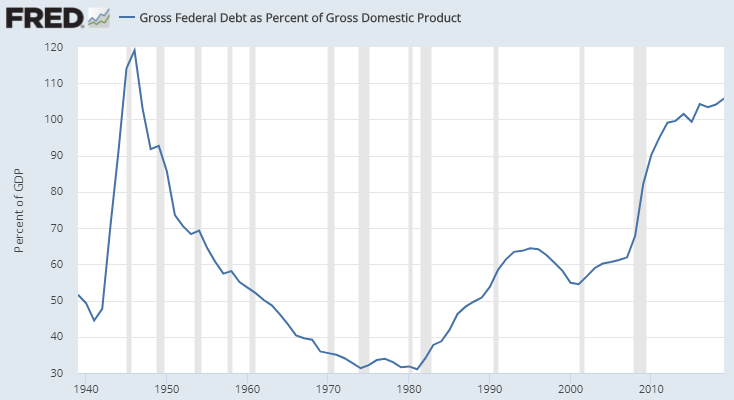
What matters more than just federal debt held by the public, in our view, is the total amount of federal debt — also known as gross federal debt — which includes non-public holdings like the debt held on the Federal Reserve’s balance sheet.
On a gross federal debt basis, the government debt burden crossed the 100% threshold in 2014 and is now almost 106%. This compares to a peak of 119% debt-to-GDP back in 1946.
You can see the dramatic rise in debt-to-GDP levels, which went vertical after the 2008 financial crisis, in the FRED chart below.
It matters that the publicly held portion of the debt is set to cross 100% of GDP, because that is a news item that will enter the public consciousness. But in practical terms, the U.S. has been flirting with World War II debt levels for years, as a result of huge stimulus in the aftermath of the 2008 financial crisis.
The debt level matters because excessive debt is a burden on future economic activity. The higher the debt level, the larger the payments become to pay off the interest on that debt.
For an individual borrower, the accumulation of too much debt leads to insolvency, and then to bankruptcy. This happens because the cost of debt service — making payments on the debt — eats up all of the borrower’s income and cash flows.
For a corporate borrower, the same thing can happen, assuming they aren’t connected enough to score a lifeline from the Federal Reserve. An extreme debt burden, barring some kind of rescue, destroys the borrower’s ability to repay.
A sovereign government is different, however, because sovereign governments tend to borrow in their own currency.
This means that, when the sovereign debt burden gets too high, there is never a need to declare actual default. The sovereign debtor can just crank up the printing presses instead, and inflate away the value of the debt by making payments with newly printed currency.
When a sovereign government starts inflating away the debt in earnest, this can make public debt holders uneasy. Most debt holders are uncomfortable with assets that have a negative return once inflation is factored in. (If you earn 1% interest but lose 2% to inflation, you finish with a loss in real terms).
This is why, at a certain point, a kind of inflationary doom loop kicks in when the sovereign debt burden gets too high. The doom loop works like this:
- As the government tries to inflate away the value of its debt — by making payments with newly printed currency, via the help of the central bank — existing bondholders decide they would rather not own assets delivering negative real returns due to inflation losses.
- As the bondholders sell their Treasury holdings en masse, the central bank is forced to act as a buyer of last resort. If the central bank does not do this, bond prices plummet, interest rates spike, and the economy crashes.
- As the central bank buys the Treasuries that nobody else wants — due to excess supply overwhelming demand — even more currency is pumped into the system, as the central bank has to issue new currency in order to buy the bonds. This makes the inflation problem worse.
- As the inflation problem gets worse, the bond holders feel an even greater sense of urgency to get out of bonds — because now inflation is really starting to hurt returns, and the value of the currency is likely declining, too.
- This self-perpetuating feedback loop, in which bond sales lead to currency issuance, which then leads to greater levels of monetary inflation, winds up feeding on itself as the central bank slowly loses control. The intensity of bond selling increases, which by necessity increases the magnitude of Federal Reserve buying, which pumps more fiat currency into the system, which then makes everything worse.
The mechanism just described is what Ludwig Von Mises, the great Austrian economist, was referring to when he said credit-happy governments would ultimately have to choose between destroying the economy or destroying the currency.
When the sovereign debt burden gets too heavy, you alleviate it with rescue mechanisms funded by fiat currency. If you do too much of this, the currency gets destroyed. But if you don’t do enough of it, the economy gets destroyed. The currency is sacrificed to prop up the bond market, and the bond market is propped up to keep the economy alive.
For the above reasons, the following FRED chart is probably the most important. It shows the total amount of U.S. federal debt held by foreign and international investors as a percent of GDP, dating back to 1970 (the year before President Nixon closed the gold window).
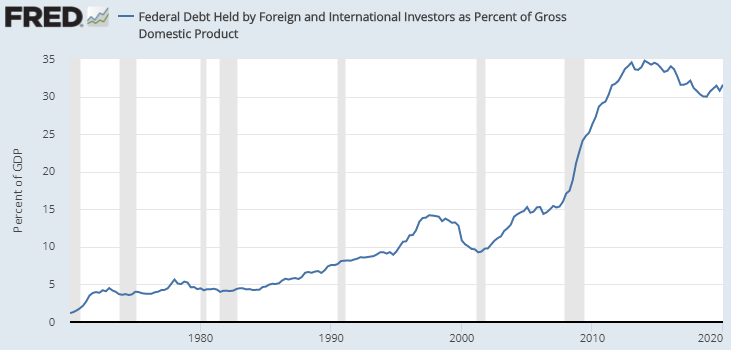
As the chart shows, the level of federal debt held by overseas investors, as a percentage of GDP, peaked in 2014 at just below 35%. How interesting: 2014 was also the year — as we saw in the earlier FRED chart — that gross federal debt crossed 100% of GDP for the first time.
Note, too, that the total amount of federal debt held by foreign and international investors has been more or less declining, as a percentage of GDP, for the past six years.
Here is why that matters: When foreign and international investors start selling their U.S. Treasury holdings in earnest, the U.S. dollar will be toast. This is because of the mechanism we described earlier.
As the U.S. government and Federal Reserve try to inflate away the U.S. debt burden, overseas investors say “no thanks” and start selling their Treasury holdings at the margins.
As the Federal Reserve pumps more fresh currency into the system, the supply of dollars further exceeds demand, making the return on investment even worse in dollar terms.
This leads to even more selling from overseas holdings of dollar assets — which largely means Treasuries, as Treasuries are still a heavily weighted percentage of holdings for most central banks.
Then, too, in the next few years, the Federal Reserve is likely to print, and stimulate, and otherwise let inflation “run hot” to a greater degree than anyone else. We know this because Jerome Powell, the Chairman of the Federal Reserve, has told us so.
Meanwhile, in Europe, the German Bundesbank — probably the most hawkish institution in the world — will step in if the European Central Bank (ECB) tries to get too aggressive.
And the net result? A big-trend U.S. dollar decline that could run for years, as the world sheds its excess dollar assets.
This is why the chart showing foreign and international investor holdings debt-to-GDP terms is the chart that matters the most. When that downtrend starts to accelerate in earnest, watch out.
With that said, it matters that federal debt held by the public will cross 100% of GDP in the coming year.
But it matters mostly as a psychological driver, and a possible trend accelerant, because the public will pay closer attention now — and so too will overseas investors — to a pile of federal debt that has looked mountainous at least since 2014, with the government all but promising to inflate that debt away.