Here’s How I Spot Big Winners (Stock Pick Inside)
Editor’s Note: Today, I’ve asked our friends at LikeFolio to write a guest editorial for the TradeSmith Daily. If you’re not familiar with LikeFolio, they use proprietary technology and an exclusive contract with Twitter to mine more that 500 million tweets per day to determine consumer sentiment and purchase intent for more than 300 public-facing companies. The results give them insight that, when married with the tools of TradeSmith, can give you an enormous advantage. Enjoy (and I’ll be back tomorrow). — Keith
Let’s face it, hindsight makes picking winners seem obvious.
Once you’re looking in the rear-view mirror, all of the factors leading up to a strong company performance are clear.
But hindsight is a day late and a dollar short.
That’s why it’s important for investors to have foresight and an edge.
Because the truth is, the signs of incoming success are there long before everything seems to “click.”
At LikeFolio, we specialize in spotting these signs.
How?
By tapping into the power of social media data to determine consumer demand and happiness, in real-time.
Today I want to share with you the process we use to spot tomorrow’s big potential winners, before they become darlings of Wall Street.
And I’ll even use a real example from the fashion industry to do it.
First Step: Identify Big Shifts in Consumer Macro Trends
2020 is the perfect example to showcase how much shifting consumer behaviors can move the needle for publicly traded companies.
Just think about how the pandemic impacted the way we work — via Zoom Video Communications (ZM) — what we do for fun — binging on Netflix (NFLX) — and even how we exercise — via Peloton (PTON) or other at-home alternatives.
Now, the pendulum is swinging in the other direction.
Travel is resuming, live sports are popping, and consumers are getting more social.
What do all of these have in common?
Consumers need something to wear.
Check out how these trends in retail apparel are developing:
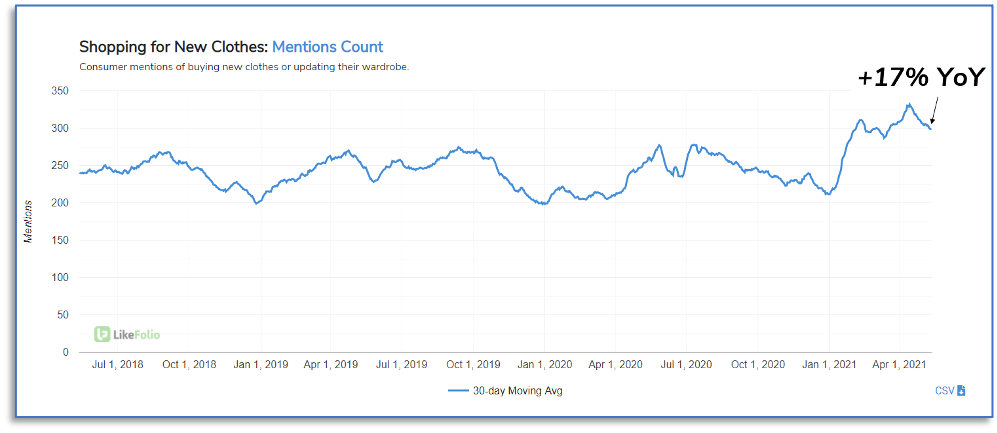
Consumer mentions of shopping for new clothes have increased +17% YoY and are hitting multi-year highs. And that’s before things really open up.
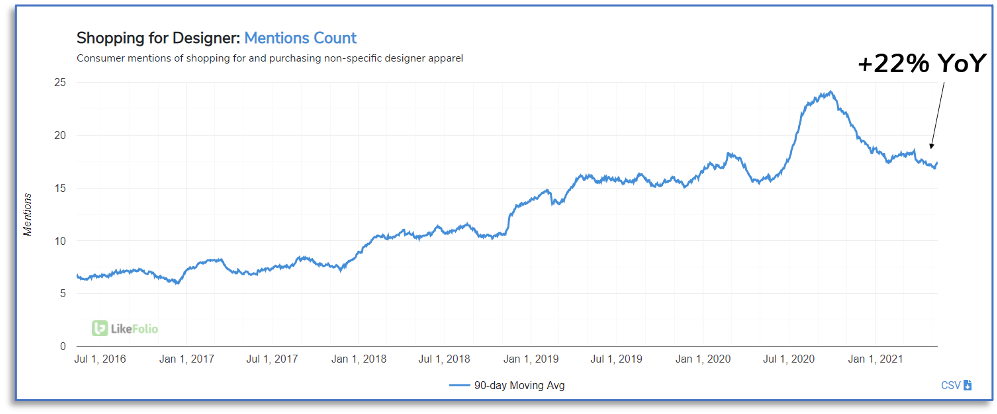
Building on this, consumers are showing a preference for a certain type of apparel… and this time it’s NOT yoga pants.
Check out demand for Designer Clothing (think luxury brands):
Now that we have identified two compelling consumer macro trends, let’s dig deeper and look at the players in this space.
Second Step: Find Companies That are Outperforming Peers in Consumer Demand & Happiness (but May Not Be the Biggest Player on the Field
Three names that specialize in some form of luxury retail (and operate online) are Poshmark (POSH), Farfetch (FTCH), and Revolve (RVLV).
To get a view of how well consumers are reacting to these companies, I like to plot them all on the same chart against each other:
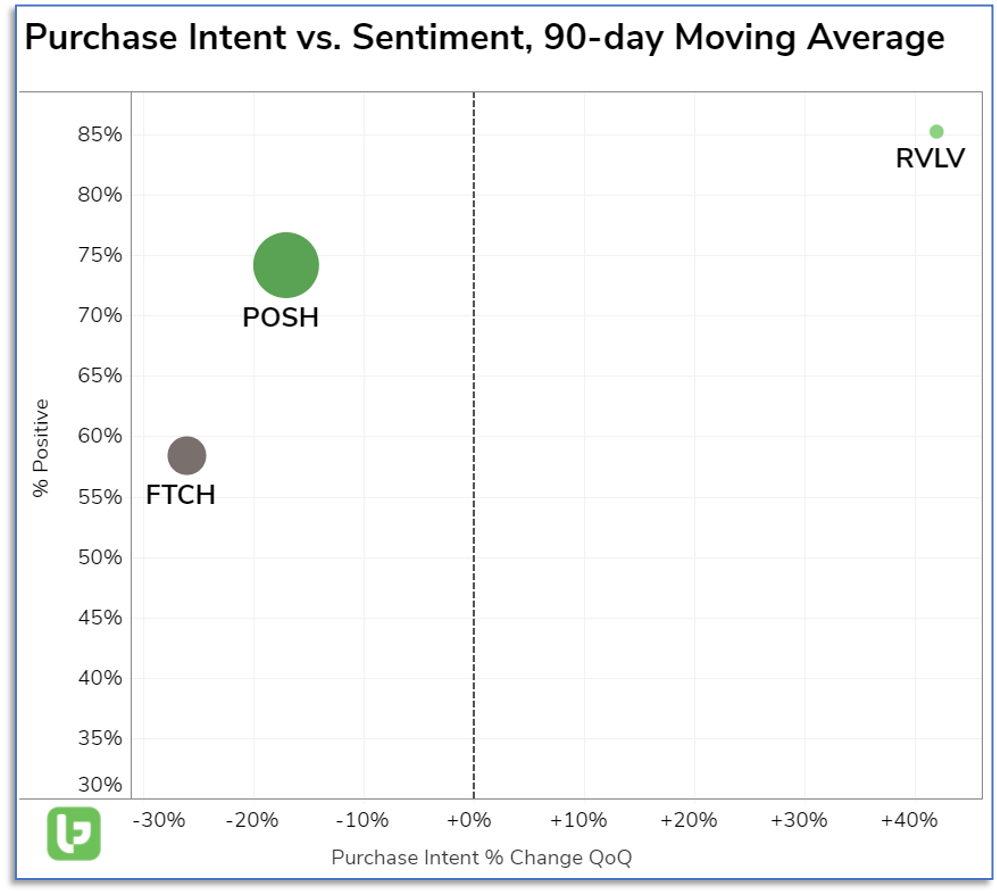
Now we can dig in and see which company is standing out from the pack.
I’m guessing you already see where this is going, because it’s so intuitive.
The x-axis represents consumer demand growth, or what we call Purchase Intent.
How many consumers are talking about completing a purchase on the platform now versus last quarter?
The y-axis represents Consumer Happiness.
How happy were consumers during their interaction with the brand or company?
Put both of these metrics together, and you could spot something special.
And look who’s there — all alone in the top-right corner, exhibiting both demand growth and happy customers.
Revolve (RVLV) is an e-commerce platform specializing in fashion, that also has a specialized luxury lens: FORWARD.
Feels like everything is starting to click, doesn’t it?
While RVLV may trail peers when it comes to overall mention volume, consumer demand is growing, happiness is high, and it is being propelled by major macro tailwinds. In addition, RVLV has been in the TradeSmith Green Zone for more than 11 months and is in an uptrend.
On its last report, RVLV handily beat EPS and Revenue projections, and the company noted acceleration into the current quarter:
“Our top-line trends saw substantial acceleration as we entered March increasing from the low single-digit growth we experienced in January and February. Then as vaccines started to roll out, restrictions eased, [and] additional stimulus payments were made by the federal government [so] demand increased significantly. The strong close to the quarter continued into April with growth of over 100% compared to April 2020 and over 30% compared to April 2019. “
Despite a strong report and initial reaction, shares of RVLV are trading more than 30% lower than previous highs, creating a unique opportunity for investors.
Don’t you love it when consumer insights data brings everything so clearly into focus?