History Says TSLA Is a Buy
If these two lines keep breaking out, look out… A key TradeSmith gauge at its most fearful level since October… But it’s no reason to fear… Tesla is entering uncharted territory ahead of earnings… Bitcoin continues its disinflationary path… Make the most of this crypto bull market…
By Michael Salvatore, Editor, TradeSmith Daily
When you look at the S&P 500 on any given day and see it’s up or down… it doesn’t actually tell you a whole lot.
That might sound crazy to you. The S&P 500 is the most widely traded group of equities on the entire planet. It should tell you everything.
But all it really gives you is the 1,000-foot view of whether traders are bullish or bearish that day… and almost nothing about the future.
That’s why our whole mission at TradeSmith is to dig deeper with data. There are far more useful signals lurking beneath the surface.
Once you find them, you get a much clearer picture of where stocks could head next.
Here’s what I mean…
Take a look at this chart. It compares the S&P 500 (SPY, yellow line, left y-axis) with two key sector ratios – staples stocks vs. discretionary stocks (XLP/XLY, blue) and energy stocks vs. the S&P 500 (XLE/SPY, orange):
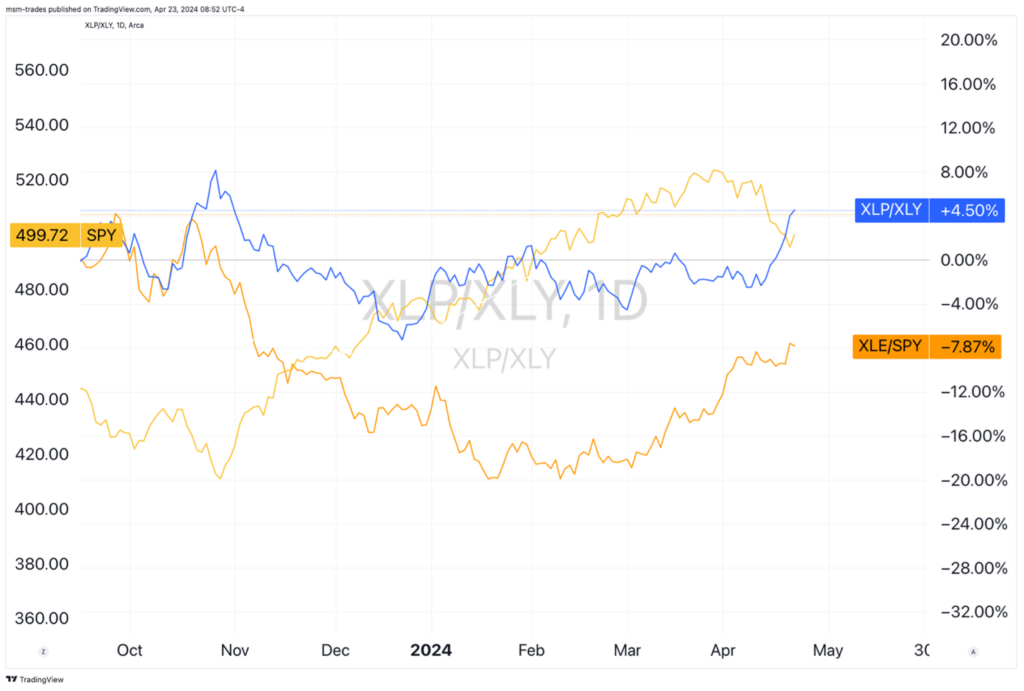
These two ratios, both breaking out right now, are screaming “risk off.”
Here’s why… starting with the XLP/XLY ratio.
When investors are buying more staples stocks than discretionary stocks, they’re anticipating a weaker consumer going forward.
Think of staples vs. discretionary as “needs” vs. “wants.” When “needs” companies are outperforming – think Walmart, Procter & Gamble, Johnson & Johnson – it’s defensive posturing. Especially since “wants” companies like Amazon, Disney, and Louis Vuitton tend to lead the market in good times.
That ratio is at a six-month high, and the highest since the last rough period for stocks that ended in November. Also of note is that betting on staples stocks over discretionary stocks has beaten the S&P 500 itself since September.
Earnings are the lifeblood of consumer discretionary companies, and their weakness against staples suggests traders aren’t confident in the idea of “wants” outperforming “needs” in the future.
Next is energy vs. the S&P 500, which we’ve covered before.
Energy stocks are another important defensive sector, this time based on their fundamentals. The sector is both dirt-cheap (XLE stocks have an average price-to-earnings ratio of 12.5) and has some of the highest dividend yields (over 3%) of any other.
The sector is also driven by energy prices… but the recent price action, with the sector outperforming even as oil prices dropped and stocks slid, shows more of a risk-off appetite.
I’m writing this on Tuesday morning, and if you’re looking at just the S&P 500, it looks like the correction is already done. And it may be.
But keep an eye on these ratios beneath the surface of the market. If they continue to run, it could spell trouble.
❖TradeSmith’s Fear & Greed gauge just briefly dipped into “Fear” levels for the first time since November…
Here’s a look at the gauge readings over time:
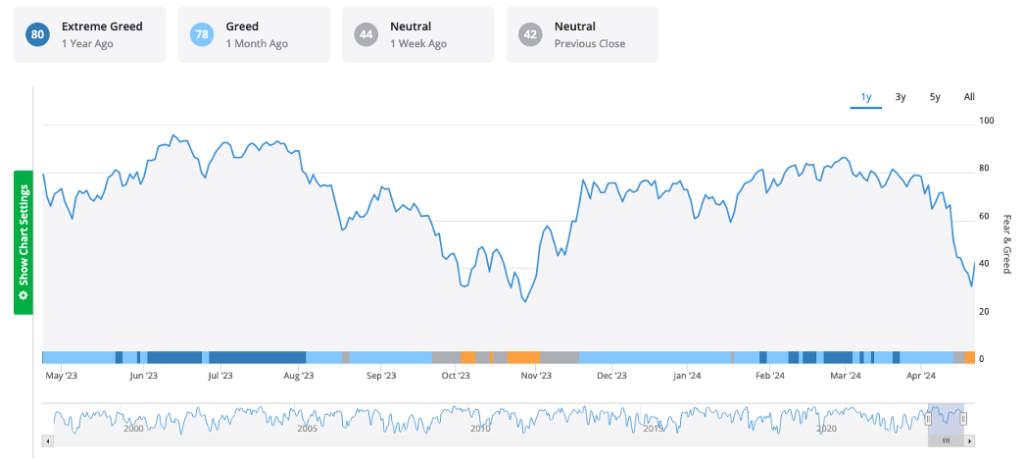
It’s important to understand exactly what a Fear & Greed gauge should tell us. The biggest clue is in the name.
Warren Buffett famously said we should be fearful when others are greedy and greedy when others are fearful. When those emotions reach extremes, we should act opposite the crowd with even greater urgency.
Clearly, following this guidance with the Fear & Greed gauge by buying stocks back in October and November of 2023 would’ve been a great move.
Could we say the same for today?
It’s too early to call.
For one, this latest visit to “Fear” levels has thus far been too brief. We’d like to see markets stay fearful for more than a couple days, or fall into “extreme fear” levels, before we call a bottom. Especially when the ratio pairs above are acting the way they are.
Regardless, with stocks now about 4% off their highs, you’re doing better buying today than you were a few weeks back.
And there’s at least one corner of the market where fear has pushed well into extreme territory…
❖A shining ray of hope for TSLA investors…
Let me be perfectly clear.
I’m not saying Tesla (TSLA) stock has bottomed. It’s in a nasty selloff and could go a bit lower from here.
But what I am saying is that you don’t tend to see headline clusters like this at the top of Bloomberg when there’s a whole lot lower to go:
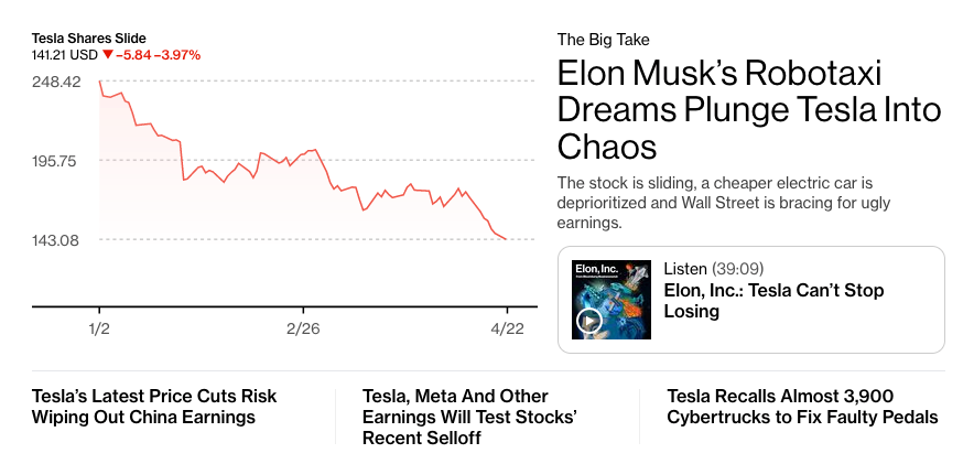
Cybertruck recalls… Price battles with China EV makers… Cancelling the $25k Tesla model in favor of a robotaxi… All this bad press is compounding on each other and causing a share price spiral.
TSLA stock is now down more than 65% from its 2021 all-time high, and down almost 44% this year alone.
Most importantly, it’s been down a full seven days in a row. That has happened only four times in TSLA’s history as a public company. It’s never closed down eight days in a row.
Observing this, I reached out to TradeSmith Daily Contributing Editor Lucas Downey for his take.
Lucas is a master of historical studies. So he crunched the numbers… and showed me this:
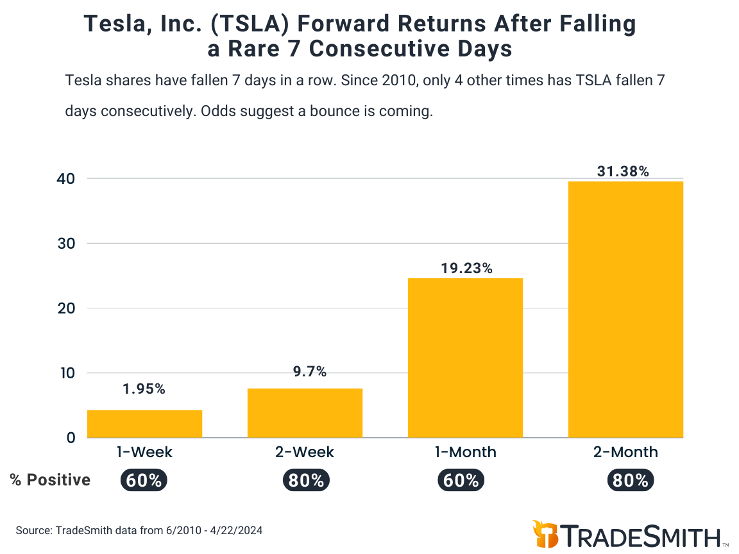
On average, TSLA falling seven days in a row foretells gains of 2% a week later, and nearly 10% two weeks later.
A month out, you’re looking at 19% gains… and over 31% gains two months later.
This near-record down streak for TSLA’s share price smells of capitulation. TSLA is one of the most volatile large-cap stocks in the market, but buying it today is certainly better than buying it even at the start of this year.
Also noteworthy is TSLA’s earnings report, due out after market close on Tuesday. Even if that report comes in soft, it would be like scraping the barrel of bad news for the pioneering EV maker.
History says down streaks like these are times to buy. We’ll know soon if that turns out to be the right call.
❖Bitcoin completed its halving over the weekend…
And with it, the King of Crypto continues on its disinflationary path toward becoming the world’s first scarce digital asset.
I’ll never tire of sharing this chart with you in TradeSmith Daily, because it really tells you everything you need to know about how to trade bitcoin and crypto more broadly:
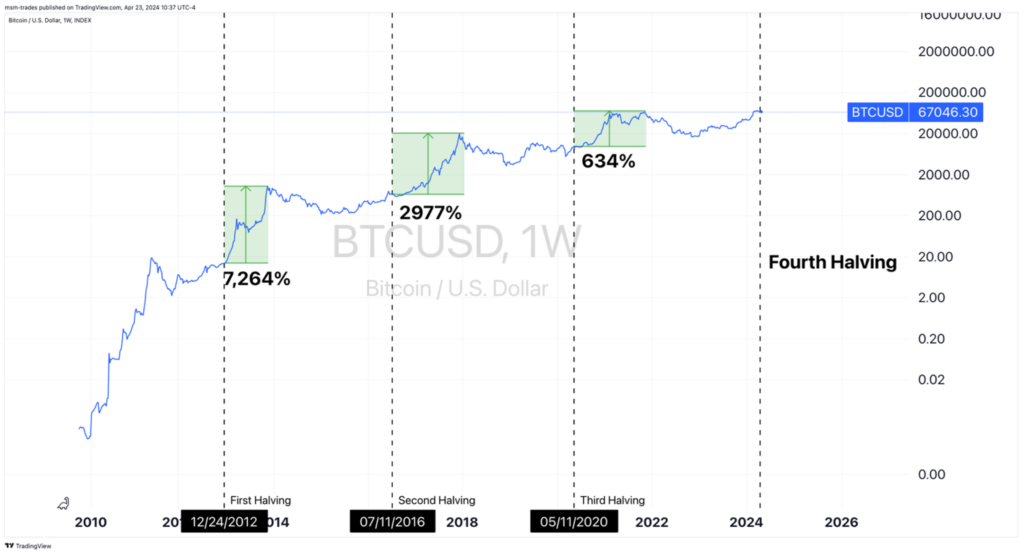
“Buy the rumor, buy the news, buy some more” may have sounded over-the-top when I first shared the mantra with you a couple months back. But it’s time to repeat it.
Many expected the halving to be a “sell the news” event. But, zooming in, we can see that prices have only gone higher.
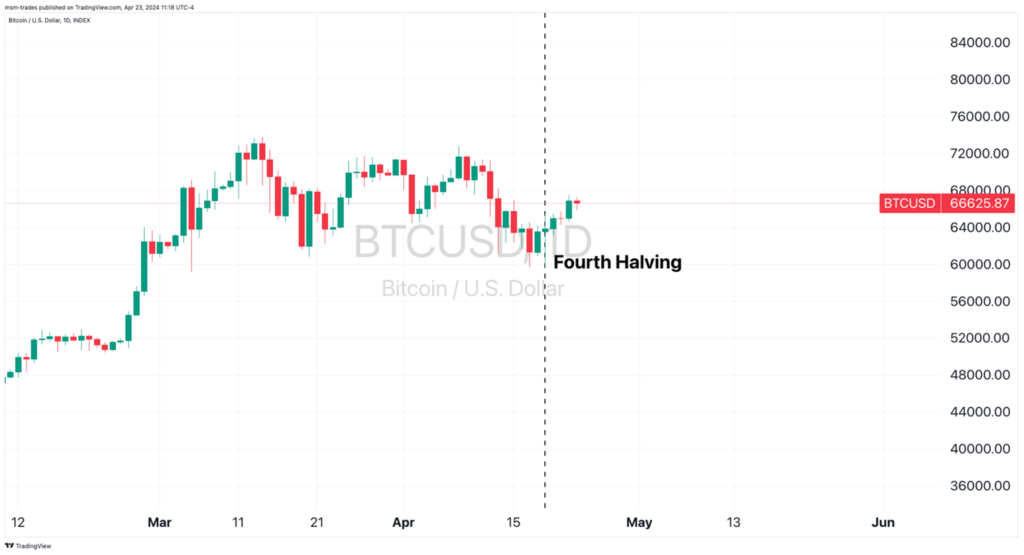
Buying the “rumor” of the halving months ago would’ve landed you a solid return. Buying the news today could do just the same.
Bitcoin could also fall lower from here, sticking to the “sell the news” script like it did when the ETFs launched.
But history tells us any downside in bitcoin from here on is a dip to buy in anticipation of much higher prices months down the road. Trade Cycles editor William McCanless said as much on Saturday, and I’m inclined to agree.
I highly encourage you to check out that interview, by the way. William shared a couple short-term trade ideas, plus his short-term downside and longer-term upside targets for bitcoin prices.
On the upside, he believes bitcoin could trade about four times higher than where it is now – roughly about half of what it returned last cycle. I’ll go out on a limb and say that’s better than what the S&P 500 will do over the same time frame.
❖But you want more, you say?
If that’s the thought crossing your mind, clearly you’re familiar with the kind of profit potential this asset class brings to the table.
The truth is, in crypto, 4x returns in a year are tame.
In the past, select smaller-cap “altcoins” have rocketed 10x and even 100x higher during broad-based crypto bulls.
Finding these opportunities is more than half the battle, though. There are a sea of new cryptocurrencies listing each day. A good number of them are junk.
You also can’t value these assets the way you can publicly traded companies. Far more often than not, cryptos offer no fundamentals whatsoever. Just pure momentum and price action… making the trade that much trickier.
Scores of analysts have tried to solve this puzzle. But I’ve seen none come closer than Luke Lango, Senior Investment Analyst at our corporate partner InvestorPlace.
This recent message from Luke sums up the opportunity at stake:
Our breakout crypto trading system just flagged the very first batch of urgent buys.
More specifically…
It just uncovered not one… not two… but five different cryptos that could be on the verge of explosive gains.
Based on insights from my system, these five cryptos have some of the highest scores in the world today.
The last time we saw scores this high from Stage 2 cryptos you could have made gains like 5,437% from MediBloc…
And a staggering 8,403% from DigiByte.
But these five new cryptos are the first official recommendations from my new breakout crypto trading system.
I predict all five of these cryptos could jump hundreds if not thousands of percent, over the next couple weeks.
And to help prove his expertise, he shared one of his top altcoin picks for 2024 – one he thinks will outperform nearly everything else in the market.
Luke’s research could give you a leg up as this crypto bull market continues.
To your health and wealth,
Michael Salvatore
Editor, TradeSmith Daily