How Cycles and Position Sizing are Connected
We’ve been talking about cycles for the past few weeks. You can get a refresher here:
- What Investors and Farmers Have in Common: The Enduring Power of Cycles
- The Lotka-Volterra Equations: Nature’s Ode to Boom and Bust
- The WeWork Implosion is a Spectacular Example of a Cycle Top (and Era’s End)
Today, we’ll explain how cycles and position sizing are connected. And we’ll do so with the help of a legendary billionaire, Howard Marks.
Howard Marks is a distressed-debt investor worth $2.2 billion. He is famous for his “memos,” multi-page client letters on various investing topics.
The insights in these memos are always clear, simple, and practical. Here is what Warren Buffett says:
“When I see memos from Howard Marks in my mail, they’re the first thing I open and read. I always learn something.”
That is one heck of an endorsement. Marks has also written a few books, the most recent of which is “Mastering the Market Cycle: Getting the Odds On Your Side.”
As you can probably guess, with a title like that, Marks is a devoted student of market cycles. Here are some direct quotes from the book — the third one being the most important:
“I can’t say an understanding of cycles is everything in investing, or the only thing, but for me it’s certainly right near the top of the list.”
“Most of the great investors I’ve known over the years have had an exceptional sense for how cycles work in general and where we stand in the current one. That sense permits them to do a superior job of positioning portfolios for what lies ahead.”
“If we apply some insight regarding cycles, we can increase our bets and place them on more aggressive investments when the odds are in our favor, and we can take money off the table and increase our defensiveness when the odds are against us.”
Howard Marks likes to adjust his portfolio exposure — which is determined by the size of positions, the total number of positions, or both — based on cycle inputs.
As a general rule, you want to have larger position sizing (or a larger number of positions) when the cycle is in your favor, and smaller position sizing (or fewer positions) when the cycle is not in your favor.
For investors, cycle awareness is like counting cards in blackjack.
To count cards — a profession that is almost extinct these days — the idea is to track the cards that come out of the casino dealer shoe (a device that holds multiple decks) to observe whether a high number of aces and face cards are left to be dealt out, or whether an average or low number of aces and face cards are left to be dealt out.
When the shoe is determined to be “rich in aces and faces” — meaning a high number of big cards remain — that is when the card counter will signal to bet aggressively, because a concentration of aces and faces tilts the odds in favor of the player. (High cards increase the probability of hitting 20 or 21, or alternatively forcing the dealer to bust.)
If we adopt blackjack as an investing metaphor, a favorable investing environment would be one that is “rich in aces and faces” in terms of the market deck, with various factors increasing the odds of victory.
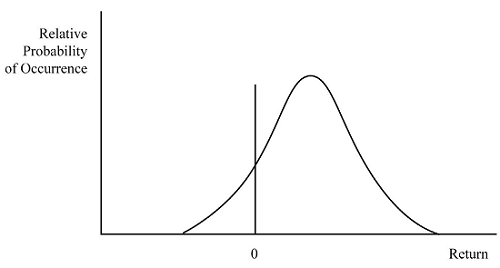
The following three bell curve graphs, from the Howard Marks book titled “Mastering the Market Cycle,” help illustrate this concept.
The first bell curve shows a “normal” market, where cycle conditions are decent, but not fantastic.
There is a reasonable probability of gain here (which is everything to the right of the zero line), but also a non-trivial chance of loss (everything to the left of the zero line).
 |
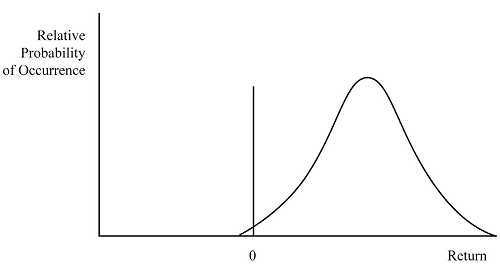
The second bell curve shows what excellent cycle conditions look like. The difference here is that the probability of loss (everything to the left of the zero line) is now extremely low.
This is what it looks like when cycle dynamics are heavily in the investor’s favor. In blackjack terms, the market is “rich in aces and faces” here.
 |
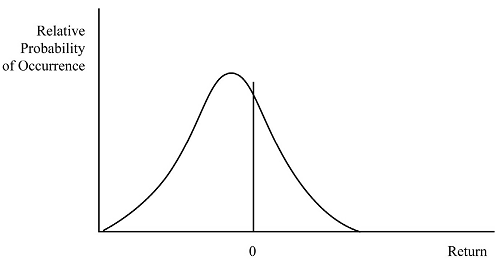
And finally, the third bell curve below shows unfavorable or even dangerous conditions, where the odds of winning are reduced and the probability of a loss is high.
Notice how the curve has shifted so that most of it is now to the left of the zero line — loss territory. These are conditions where the best move is caution, or possibly not taking positions at all.
 |
To summarize, cycles and position sizing are connected because cycle dynamics have an impact on the odds of success, which in turn impacts the size and frequency of investments (or at least it should).
- When cycle dynamics are positive, you have a greater likelihood of winning and can take larger position sizes (or hold more positions in the portfolio).
- When cycle dynamics are negative, on the other hand, you want smaller position sizes — or no positions — because the likelihood of winning has fallen (and the danger of losing has risen).
These concepts are basic, but powerful. Cycles are not a form of crystal ball — they don’t offer certainty or tell you what the future holds. But they can help put the odds in your favor, which is a very big part of successful investing. We’ll continue to dive deeper into the topic of market cycles and the factors that drive them in future articles.
TradeSmith Research Team