How to Detect a Market Crash
Editor’s Note: I’m wrapping up the final details for our big event tonight, so I’ve asked Justin Brill to share with you some of the best indicators of a coming bear market. Justin usually writes our Inside TradeSmith column, all about the best, most effective ways to use our products to best manage your own portfolio. I hope you’ll enjoy his tips on detecting a coming market crash. I’ll be back tomorrow. — Keith
The U.S. financial markets have experienced three significant crashes over the last two decades.
In 2000, the dot-com bubble exploded after stock valuations hit an all-time high and collapsed.
The 2008 financial crisis occurred in the wake of a massive housing and credit bubble that imploded.
And last year, the stock market experienced the fastest bear market on record after the widespread shutdown caused by COVID-19.
With the markets again sitting near all-time highs, many pundits predict that another crash could happen soon.
It wouldn’t be unprecedented for a market crash to occur shortly after a previous one. The 1800s were littered with multiple examples of financial panics and depressions that hammered the U.S. economy (sometimes just a year or two apart).
Fortunately, some things have changed since then. Most important, advancements in finance and technology have made it easier for ordinary investors to detect an imminent market crash.
Today, we’re looking at four different factors you can use to determine when the next market crash may occur.
Stock Valuations
What goes up must come down. When it comes to stock valuations, there is typically a reversion to the mean.
Every stock has a crucial valuation metric known as a price-to-earnings (P/E) ratio. This valuation recognizes the number of years it would take for a company to justify its stock price based on its annual earnings.
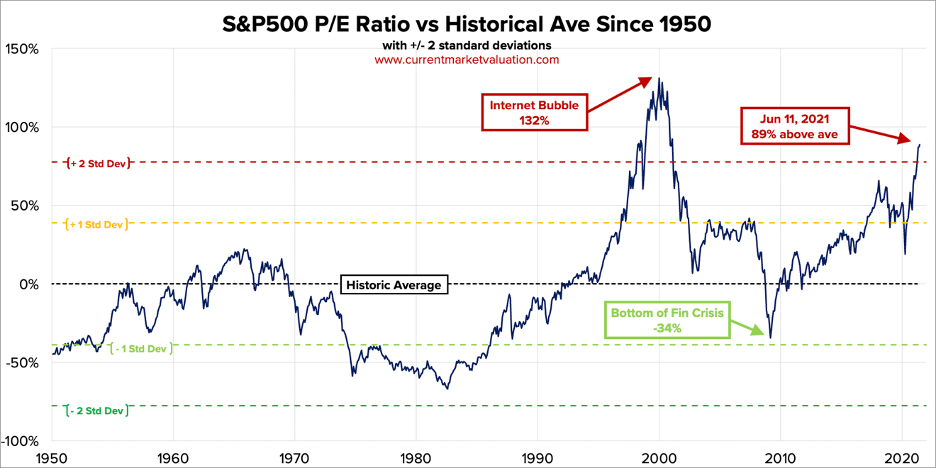
Historically, a high price-to-earnings ratio on the S&P 500 has signaled trouble.
As you can see below, this ratio is currently 89% – or more than two standard deviations – above its historical mean dating back to 1950.
It hasn’t been this high since the peak of internet bubble in the late 1990s.
This next chart shows a version of this metric known as the Schiller P/E Ratio or cyclically-adjusted P/E (CAPE) Ratio.
This version uses a 10-year average of inflation-adjusted earnings to give a more accurate measure of market valuations over long periods of time.
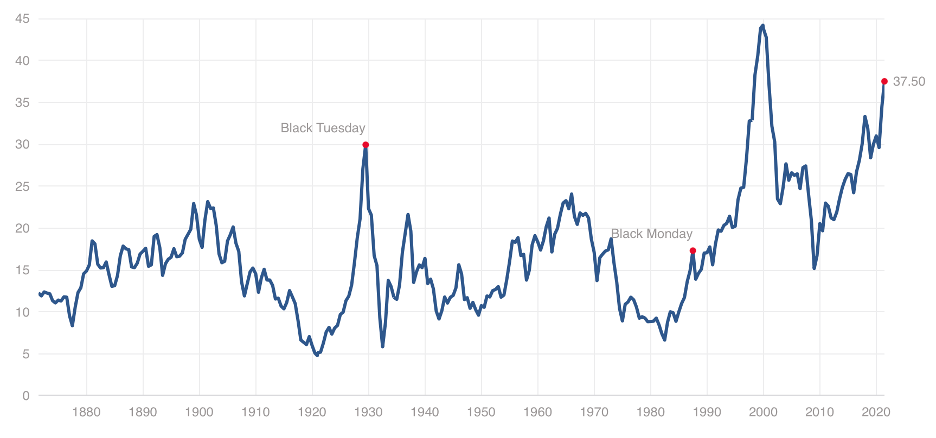
As you can see, this ratio hit 37.5 in mid-June 2021. Again, that is the highest level in this metric since the dot-com boom. But it’s also well above the peaks of Black Monday (the day of the 1987 stock market crash) and Black Tuesday (prior to the onset of the Great Depression in 1929).
These are clear signs of a “frothy” market.
However, when you combine this metric with others listed below, you can start to pinpoint the likelihood of a crash with greater precision.
Credit Quality
The U.S. economy operates heavily on consumer and business credit. Banks and other institutions lend money to borrowers to make purchases, start businesses, and engage in other forms of economic activity.
However, history has shown there is a limited pool of qualified buyers. And in nearly every financial crisis, deteriorating credit quality has played a role.
In 2008, for example, the U.S. housing crisis was fueled by banks making hazardous loans and creating additional trading products whose performance was based on the quality of the underlying credit instruments like mortgages and auto loans.
One metric to watch is the yield of high-yield or “junk” bonds. These are corporate bonds rated BBB- or lower on the Standard & Poor’s and Fitch scales, or Baa3 by the Moody’s scale.
Typically, we will see a spike in junk bond yields ahead of economic challenges and ensuing market downturns. This is because investors become extremely cautious about their lending money as the threat of potential defaults begins to rise.
As you can see in the chart below, junk bond yields spiked during the dot-com bust, the 2008 financial crisis, and the onset of the COVID-19 pandemic.
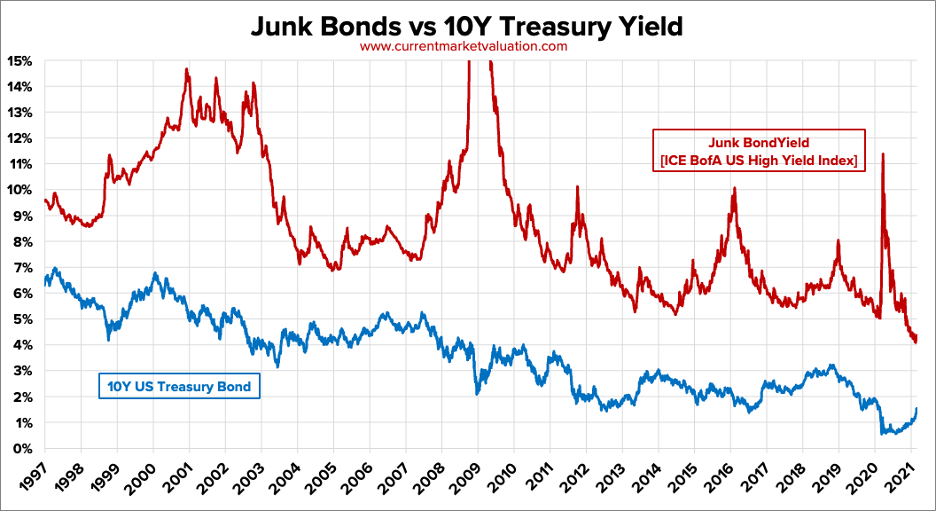
Junk bond yields are currently sitting at multi-decade lows due to the Federal Reserve’s unprecedented monetary stimulus following the COVID crisis last year.
However, a reversal in yields would be a strong signal that trouble is brewing again.
Relative Strength Index
Next, the Relative Strength Index (RSI) can give investors an edge in determining when the market is due for a selloff of some degree.
The RSI is a momentum indicator that measures the rate of the rise or decline in an asset or index to identify “overbought” or “oversold” conditions.
The RSI is measured on a scale of 0 to 100. Readings of 30 or below indicate that an asset is oversold and may be due for a move higher, while readings of 70 or higher indicate an asset is overbought and may be due for a pullback.
The chart below shows the S&P 500’s performance versus its RSI since mid-2016.
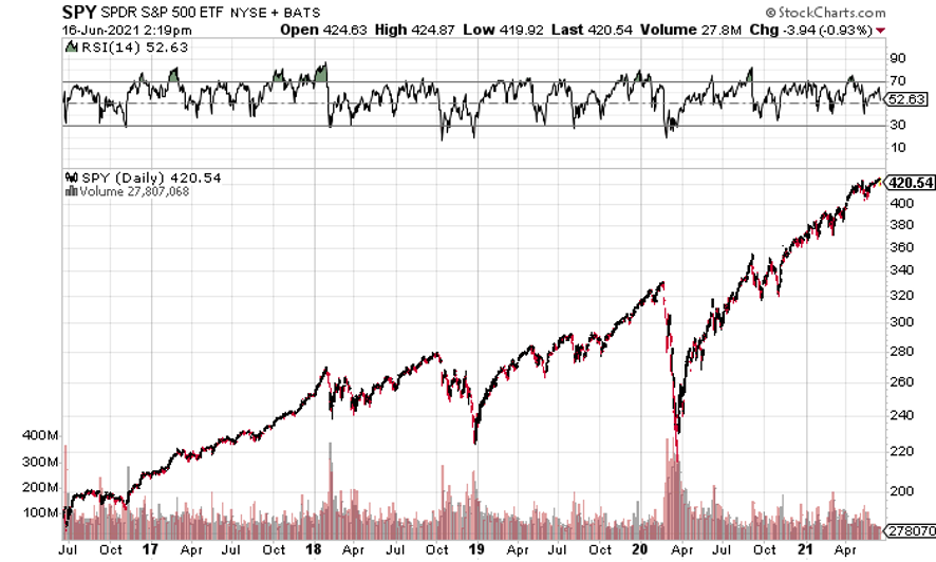
As you can see in the dark line across the top of the chart, there is a correlation between significant pullbacks and high RSI. For example, the RSI rose sharply in late 2017 to nearly 80. An ensuing selloff hit the markets at the beginning of 2018.
Similar extremes in the RSI preceded the March 2020 crash as well as the broad-market correction last summer.
Many investors will take gains off the table in overbought conditions and wait for a pullback in such situations.
Insider Selling
Finally, we have a metric known as insider selling.
You don’t usually hear much about this one, but it can be one of the most powerful warning signals in the financial markets.
Insider selling is exactly what it sounds like. It’s when a corporate executive or board member sells their own company’s stock on the open market.
No one knows more about the valuation of a company and the strength of a balance sheet than the corporate officers in charge. So, investors should always pay close attention when these officers are buying or selling their shares.
For example, in February 2020, insider selling of stocks surged as COVID-19 spread. Yet as markets have rebounded and hit new all-time highs this year, corporate insiders have once again been selling their companies’ stocks. In fact, they’ve been selling at a pace not seen since 2008, right before the financial crisis.
It’s also important to note that insider buying can provide the same type of signal when a rebound seems imminent.
Unlike some of the other metrics I mentioned, this information is freely available to the public. Corporate insiders who make informed purchases or sales of their company’s stock must fill out a Form 4 to comply with U.S. Securities and Exchange Commission (SEC) regulations. You can find the forms on EDGAR, the agency’s corporate document registry.
Conclusion
Investors should be wary of another financial crisis. Given the ongoing uncertainties around inflation, stock market valuations, geopolitics, and more, a potential meltdown could happen at any moment.
I encourage you to keep an eye on the warning signs I mentioned above. Only vigilance and diligence will protect you from a nasty downturn in the financial markets.
There are other metrics and tools that can help protect your principal and your profits as well. And this evening, we’ll unveil our No. 1 tool to help you eliminate the stress of investing in volatile markets.
If you want to learn more, be sure to join us tonight at 8 p.m. Eastern to learn a powerful new way to make money in bull and bear markets alike. I promise you don’t want to miss it. Click here to reserve your spot before 8 p.m. Eastern.
Until next time.
Stay safe out there.