How to Make Money from Short-Term Stock Moves
Editor’s Note: One reason I wanted to partner with TradeSmith is the company’s focus on data and analysis, which are the foundation of my Quantum Edge system and its proven success.
I designed the system to remove emotions from investing decisions, and to accurately forecast stock price movements by analyzing the right data the right way.
We’re enjoying big gains by owning the highest-quality stocks in the market for medium and longer-term holding periods, but there are smart people – and systems – that can also make money by spotting shorter-term opportunities.
Today, I’d like to turn Power Trends over to CEO Keith Kaplan to tell us about some TradeSmith indicators that use data and analysis to better spot these opportunities and earn impressive returns from them.
The great investor Benjamin Graham – a man known as the “dean” of stock analysis – famously wrote that investing in stocks is like partnering in a business with someone who is extremely emotional.
One day, your partner, who Graham called “Mr. Market,” is deliriously happy and giddy about the future. The next day, Mr. Market is horribly depressed and sees disaster on the horizon.
On the days he is happy, Mr. Market is willing to only sell his share of the business for a sky-high price. On the days he is miserable, Mr. Market will sell his share of the business for peanuts.
Graham wrote about Mr. Market in his book The Intelligent Investor all the way back in 1949… 75 years ago.
But it’s still talked about today because of his student, Warren Buffett, who became legendary for his wildly successful long-term investments:
Coca-Cola (KO), for example, has made Buffett’s Berkshire Hathaway more than $20 billion in 35 years.
But when you think back to the parable of Mr. Market, it can’t be denied that, while you make a lot of money by buying low and selling high over the long-term…
Stocks go up and down in short-term cycles, too.
“Mini Bull Markets” are Playing Out Every Week
Do you remember fractals from geometry class?
A fractal is a shape that is part of a larger series of shapes.
One part of the fractal will look the same as other parts of the fractal, no matter if you zoom out or in. The whole set of shapes is said to display “self-similarity”: The component parts resemble the whole.
You can find fractals all over the place:
- Tree trunks and their branch systems are fractals.
- Other plants like pinecones and Romanesco broccoli, grow in fractals, too.
- Lightning bolts travel through the air in fractals.
And cycles researchers like Ralph Nelson Elliott, even before Graham’s day, discovered that stocks move in fractals, too.
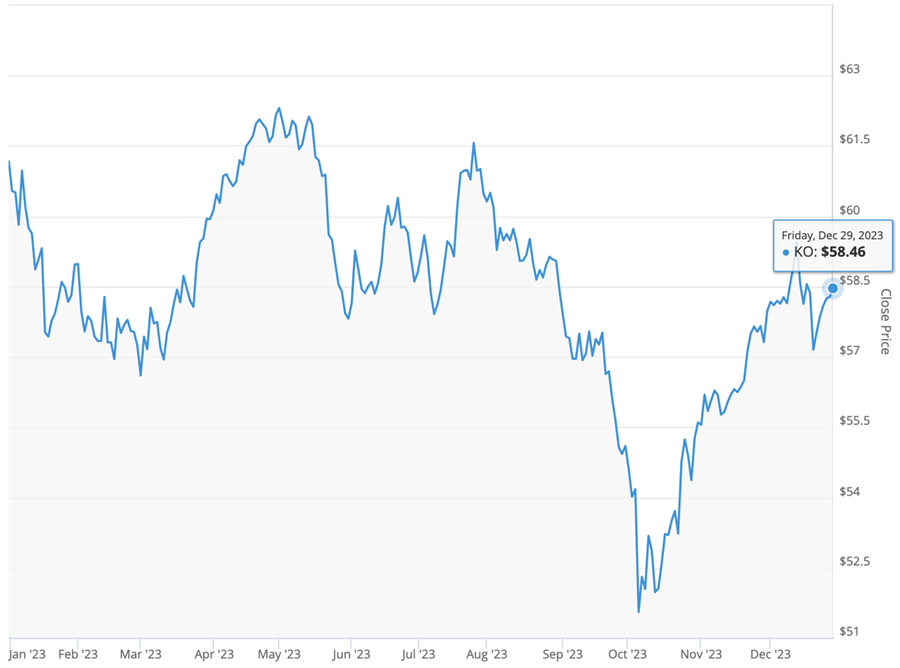
Here’s how Coca-Cola’s share price looks on a one-year chart. As you can see, shares bobbed up and down during the entire year:
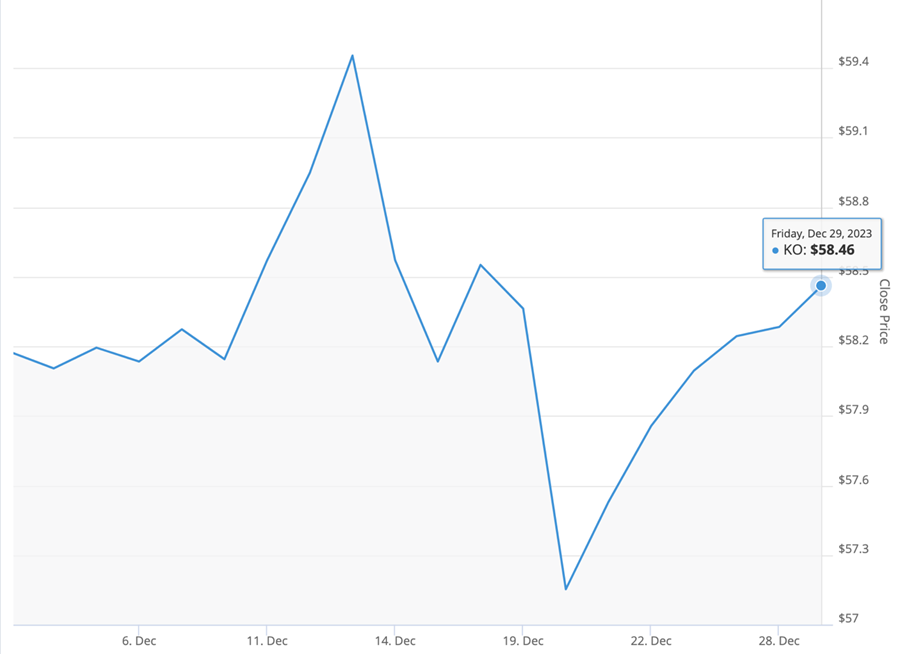
Now take a look at this one-month chart of Coca Cola. As you can see, shares bobbed up and down during the entire month:
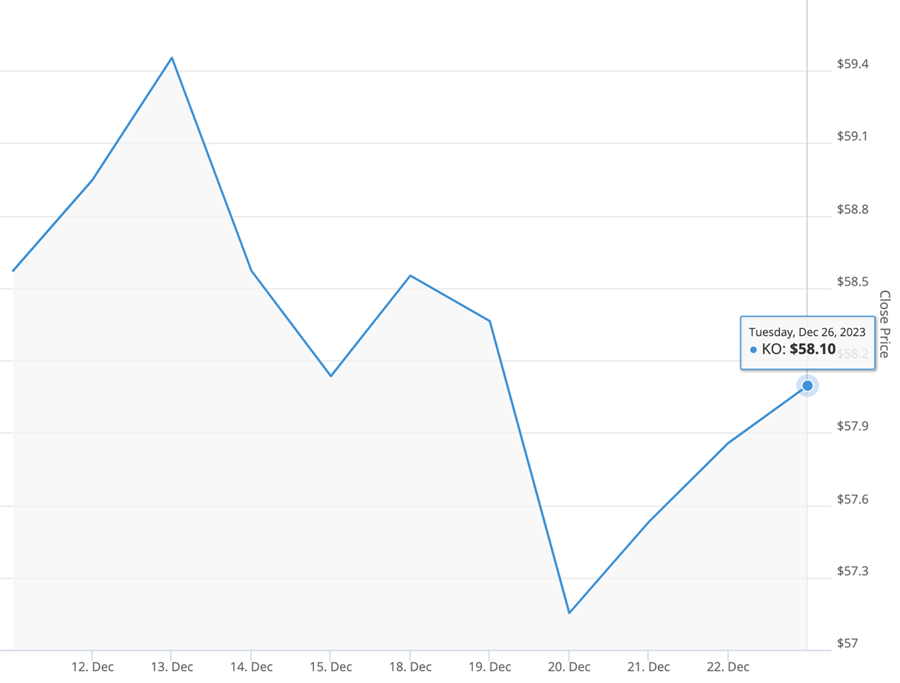
And finally, take a look at this two-week chart of Coca Cola. Shares bobbed up and down during the two weeks… in the same kind of cycling between up and down moves as in the one-month and one-year timeframes:
It doesn’t play out identically on every single timeframe. But when you feed an investing algorithm enough stock-price data…over enough years…you can learn which cycles have a high probability of playing out next. Like, for example, our TradeSmith Probability Indicator that helps us find what we think of as The Perfect Trade.
No matter what stock or stock index you look at… No matter what timeframe you look at… You’ll see rallies and declines. Mr. Market can only stay in one “mood” for so long.
When it comes to looking at multi-year timeframes, we call the rallies bull markets… and we call the declines bear markets.
But since the stock market is a fractal, there are “mini bull markets” (and “mini bear markets”) playing out every week.
Cycles Are Everywhere; It’s Just a Matter of Spotting Them
We live our entire lives on cycles:
- The seasons move in cycles: spring, then summer, then fall, then winter.
- The Earth’s rotation creates cycles of day and night.
- The tides move in cycles.
- The circadian rhythm is a 24-hour cycle that dictates how alert and tired we feel.
When it comes to things that move in cycles, the fact that one part of the cycle will eventually give way to the next part of the cycle is as sure as death and taxes.
Applied to the stock market, we must remember: No matter how strong an up or down move is, at some point it will be followed by a move in the opposite direction.
Along with our Probability Indicator, we have another tool at TradeSmith – our Trade Pattern Indicator – that charts out the Peaks and Valleys in a stock price over different timeframes.
They’re similar to the past Peaks and Valleys you can see on a historical price chart with your naked eye…
Only this algorithm crunches all the data it has on historical prices – to signal you to upcoming Peaks and Valleys.
That’s the second component of “The Perfect Trade.”
I’ll admit, cycles research can get pretty wacky at other firms… So, if you’ve been seeing any laughable claims about a very dramatic stock move that’s supposed to happen on a weirdly specific day… I think you’ll be surprised at how scientific our method of trading cycles is.
I promise: At TradeSmith, we don’t believe in financial myths and fairy tales.
We prefer to let the proof be our guide. We let the numbers do the talking. Jason Bodner is a great example of this with his Quantum Edge system.
So are our Probability and Trade Pattern Indicators. And I’m proud to say that, in the first six months of deploying this strategy, our analyst ended up finding 32 Perfect Trade opportunities that resulted in an annualized average gain of 475%.
Join me at 8 p.m. Eastern on April 18 to learn more. You can RSVP at this link to reserve your spot.

Keith Kaplan
CEO, TradeSmith