How To Pick Money-Making Stocks: Part 3
Picking winning stocks is a near impossible game.
That’s because only a handful of stocks account for all of stock market success.
This was proven by the impressive work of Professor Hendrik Bessembinder, who found only 4% of stocks account for all of the net gains of stocks above government bonds in the past 100 years.
To complicate matters even more, only 1% of stocks account for half of the entire net gain of stocks over bonds.
In other words, you need to be in the right 4% of stocks to supercharge your wealth. So how can we build our wealth when the odds seem stacked against us?
That’s why almost 15 years ago I made it my mission to develop a quantitative analytics system that could show me those winning stocks. And I’ve been sharing that process with you.
In case you’ve missed it, over the past two weeks I’ve given you my insider perspective on how to pick incredible stocks that will make you money and build your wealth.
In Part 1, we went over what to look for in the business (the fundamentals), and in Part 2, how to find stocks that are trending (the technicals) and have money flowing in (Big Money inflows).
These three things form a powerful stock-picking trifecta. Like the three sides of a triangle, they come together as the foundation of my investing method.
Big money buying stocks with the best quality fundamentals and strong technicals – it’s the ultimate combination with the highest odds of making you good and often great money.
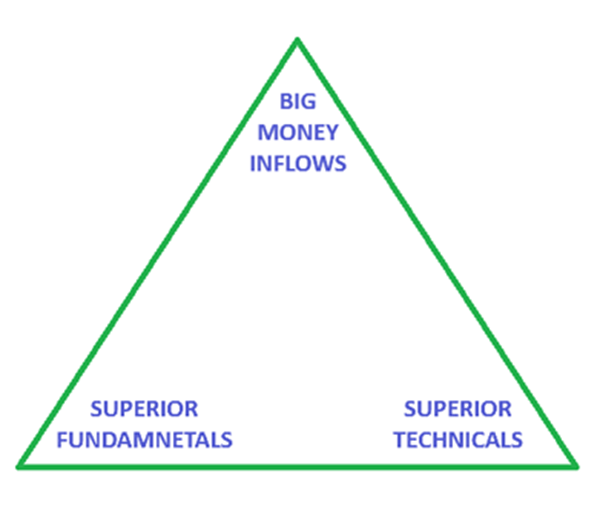
As an investor, I live inside that triangle. And to be honest, it can get a little lonely in there sometimes. These stocks are rare. By my measure, it works out to about 20 stocks per week. That’s just 0.3% of the 6,000 stocks I measure and score each day.
But I’ll take quality over quantity any day. And I’ll wait as long as necessary to buy the right stocks at attractive prices.
To help me analyze so many stocks and find the best ones, I assigning each a score based on the criteria above: the Quantum Score. It’s one elegant number – and the final piece of the puzzle – that conveys nearly all you need to know about a stock at a single glance.
It’s like x-ray results of nearly 6,000 stocks per day.
Step 4: Combine it all to Form the Quantum Score
The Quantum Score is what I refer to as the “beating heart” of my Quantum Edge system.
It is one of the most effective tools for stock-picking you’ll find anywhere, and it’s what powers my research services like TradeSmith Investment Report.
The Quantum Score boils all that data down into a single number between 1 and 100 that tells us whether a stock is likely to move higher or if it’s one to avoid. It’s all about stacking the odds in your favor.
The sweet spot for buying a stock is a score between 70 and 85. Above 85, things can get a little overheated. Below 70 isn’t horrible, but generally we can find better opportunities.
In the middle is perfect, and looks like this:
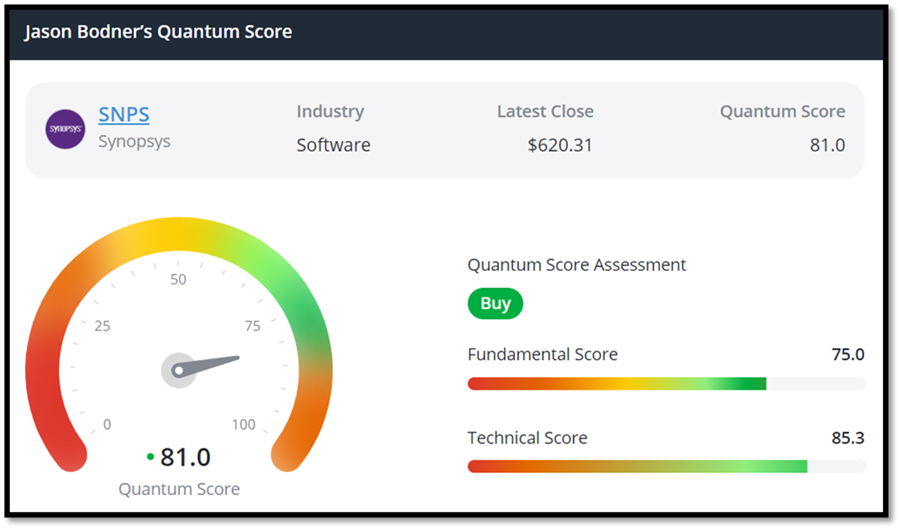
Source: TradeSmith Finance and MAPsignals.com
Synopsys is one of the stocks I recommend in TradeSmith Investment Report. It’s a great company firing on all cylinders that has already gained nearly 70% since we added it. It’s above my buy-up-to price, but there are other opportunities to get in on now… like my most recent recommendation that is still under my recommended buy limit:
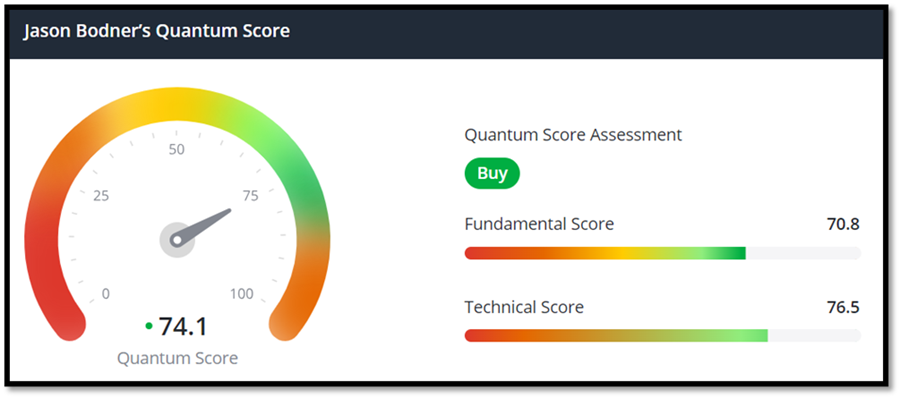
Source: TradeSmith Finance and MAPsignals.com
A Simple Solution
The fundamentals, technicals, and Big Money flows are pretty easy to understand, but they are hard to pull together on your own. Especially when you’re looking at thousands of stocks.
And that’s exactly why I put all the work in – to design a system that can analyze and score basically any stock every single day!
I use powerful computers and a world-class financial data service. Everything sits in the cloud and updates each night while I sleep. (Talk about efficient!) When I wake up each morning, I have a fresh list of the best candidates.
This systematic approach has even been proven to beat the market. In fact, one model was shown to beat the S&P 500 7-to-1 since 1990.
I didn’t know it when I began this project 15 years ago, but those 4% of stocks that beat the rest are what I devoted my time, money, and effort to finding. And that is what powers my TradeSmith Investment Report service.
I can’t show you all of the stocks here, but I can show you the current portfolio. We’re looking at a 76% win rate at the moment, with the average win at +34.8% and the average loss being -7.3%.
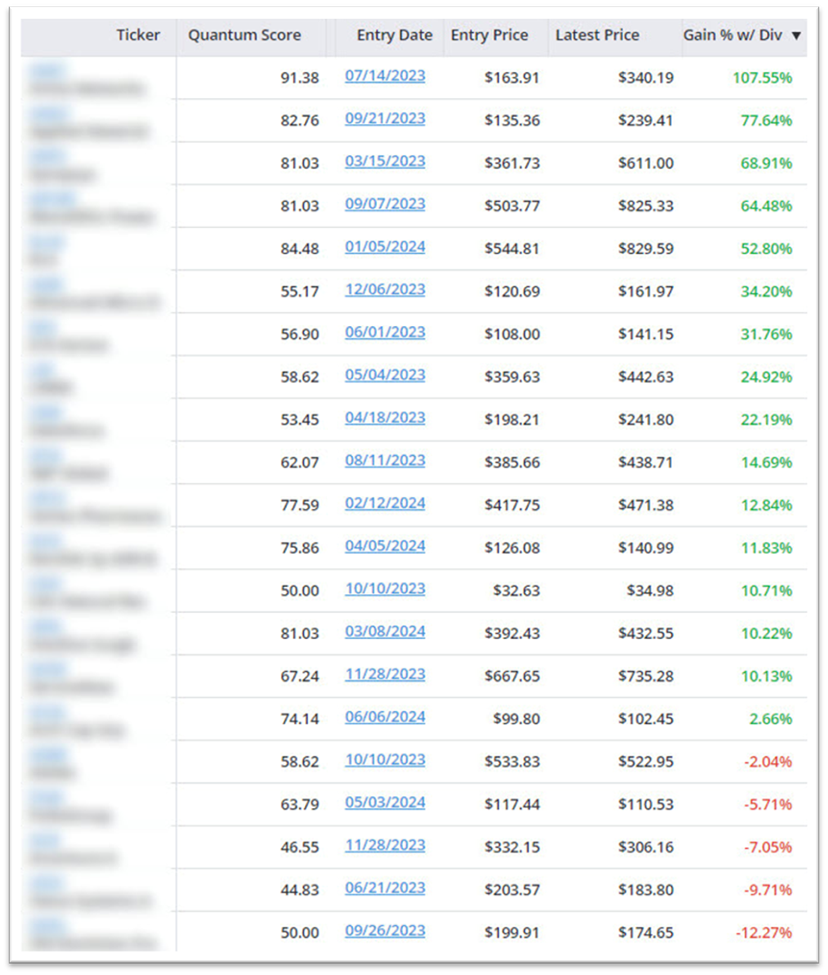
This is the power of assembling a portfolio of potential winners using the Quantum Edge method to analyze the most predictive data in the most predictive fashion.
You can do it yourself by using the techniques I outlined in this how-to series. Or, you can let me do it for you! Click here to find out how you can receive my select stock recommendations and start building your wealth with this powerful system.
Talk soon,

Jason Bodner
Editor, Jason Bodner’s Power Trends