It’s a Great Time to Buy These 5 Stocks
Market history says we’re in the worst period for returns all year.
The old saying “Sell in May and go away” perpetuates this. The story goes that British traders back in the 1800s would cash in every May, take the summer off, and “not come back till St. Leger’s Day,” a horse race in mid-September.
It has some merit. The six months between May and October are a historically weak period.
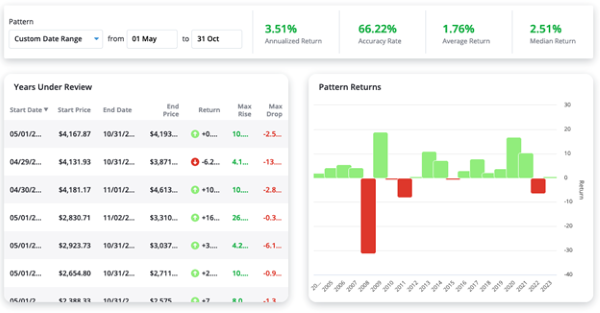
Our own dataset proves it: Since 1950, stocks have returned less than 2% on average in this time.
Well, I don’t know about you. But I don’t plan on sitting around holding my stocks for six months.
Here’s another, more modern saying for you: “There’s always a bull market somewhere.” That’s the way I like to think.
You might think it’s hard to find a bull market during this historical summertime lull. And it would be if you weren’t part of TradeSmith.
We have the tools necessary to single out stocks with the best forward returns during the next few months.
Today, I’ll share them with you… and show how you can create a “Buy in May” portfolio that could actually outperform the market going forward.
The Seasonal Anomalies
Imagine knowing the exact time to get in and out of the world’s most popular stocks.
Not only that but imagine knowing how statistically likely it is for these stocks to run during these times.
Finally, imagine you can see this through many years of market data… covering COVID, wars, energy shocks, inflation, interest rates – all of it.
Well, you don’t have to imagine it.
With our Seasonality tool, you can spot something you won’t find most places. Rather than just identifying periods of seasonal strength or weakness in the whole stock market… with our tool, you can see it for individual companies.
With it, we can find what are historically the top-performing stocks from now through the end of October.
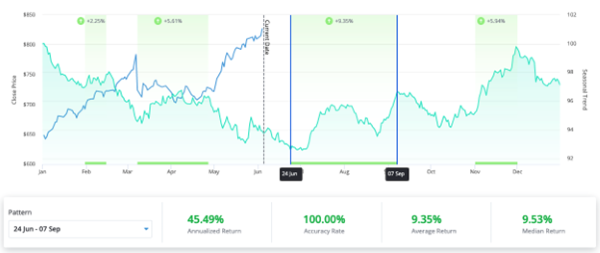
Take Tesla (TSLA) for example. Over the last 14 years, this stock has historically trounced the market even through the seasonally bearish period:
We’re looking at one of the most unpredictable stocks of the last 30 years. Most of the time, when Tesla moves, it surprises everyone.
But our data has pinned this stock down. On average, TSLA returns more than 27% from now through October. It has a positive return over 61% of the time.
That’s a pretty strong result, especially for one of the most volatile stocks in the market.
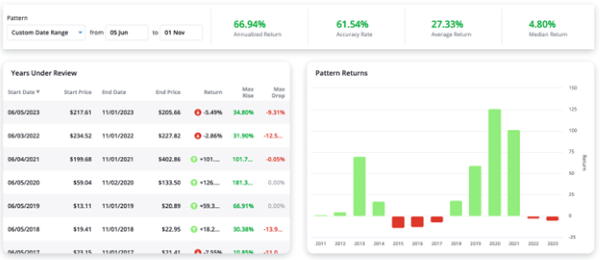
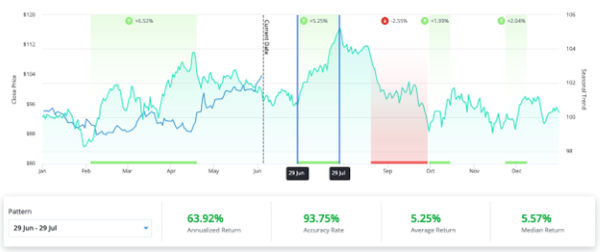
TSLA’s also currently in the middle of a seasonally strong shorter-term period. From May 22 through July 1, it rises nearly 18% on average … in less than a third of the “bearish” summer period.
It’s also had a positive return during this period 100% of the time going back 14 years:
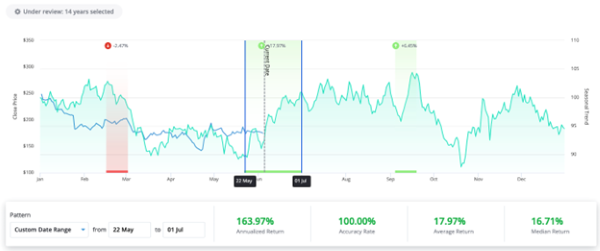
These quick pockets of seasonal strength are what we really want to see.
What else can we buy now that’s set to make big gains… and when?
We don’t have to look far. Just check out this seasonality chart of Microsoft (MSFT) over the last 15 years:
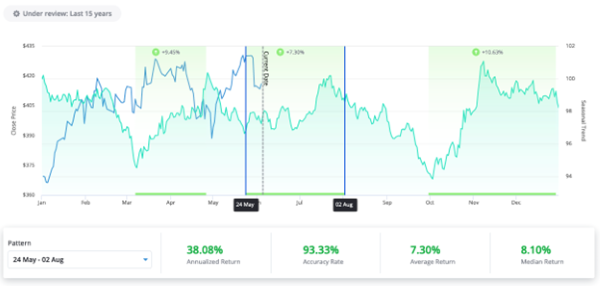
From May 23 through June 22, MSFT has returned 7.3% on average over the past 15 years. And as you can see, the biggest chunk of those returns is still to come.
And before you think this only works on big tech stocks, check out this chart of Costco (COST):
COST is set to enter a strong seasonality period from June 24 through July 4. Over the past 15 years, it’s risen an average of 9.35% and has been positive 100% of the time.
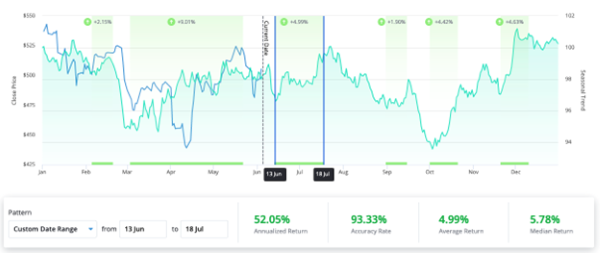
Here’s another idea on Phillip Morris (PM):
From June 29 to July 29, PM has returned 5.25% on average for the last 16 years. It’s had a positive return almost 94% of the time.
So we have a little big tech… and some strong retail and consumer staples stocks. Let’s round out this “summer slump” portfolio with a steady eddy name – UnitedHealth Group (UNH):
Once again, we see some above-average returns. UNH is about to enter a period where it gains 5% on average, and where it’s seen a positive return 93% of the time.
The average of all the returns I highlighted today is almost 9% – well above the expected returns during this bearish period.
So, we now have a group of stocks that are all set to perform well in the coming weeks – defying the “summer slump” trend.
Here’s the best way to buy them…
Pure Quant Does all the Hard Work
I’ve shown you before how Pure Quant helps you build specific types of portfolios based on conditions you set. But it can also build a portfolio out of specific stocks you want to buy.
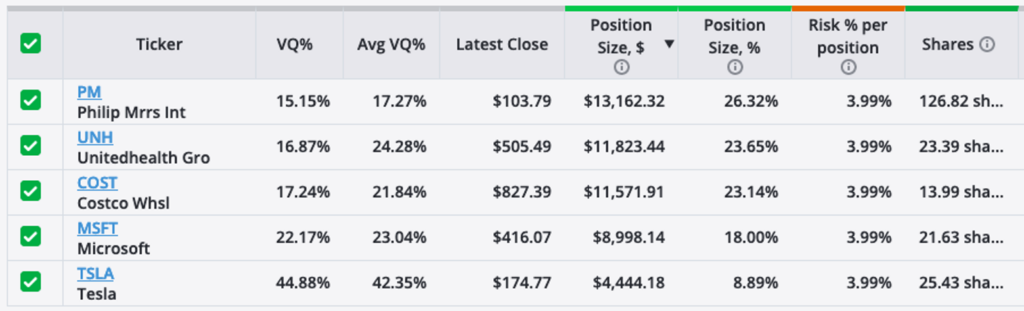
All we have to do is enter the five tickers we want to buy into Pure Quant, and it works its magic.
Now, we have a clear recommendation of how many shares of each company to buy, based on their unique volatility traits. We call this the Volatility Quotient, or VQ.
As you can see, this methodology has us buying a lot less of TSLA than we are of PM, which should give us a more stable portfolio overall.
Now, this is not the most optimal portfolio for a long-term investor. It’s not designed to be.
My purpose today is to show you how TradeSmith’s tools help you quickly turn an investment idea into an actionable plan.
You could buy all these stocks today, and then keep an eye on their Seasonality patterns. Once a pattern is completed, you could sell the stock and wait for the next pattern to roll around.
Or, you could a buy call option on these stocks for even more upside juice.
What if you built a list of stocks set to perform badly in the coming weeks… and then traded put options on them to profit as they fall?
Or looked for stocks with flat trading patterns over the coming weeks… and then sold options on them to take advantage of the choppy trade action?
The big point is, TradeSmith’s tools give you everything you need to turn any investment idea into reality. That’s the power of our software, and it’s why I love being part of this firm.
I’ll continue sharing new and novel ways you can use TradeSmith’s software every week here in TradeSmith Daily. So stay tuned!
All the best,
Keith Kaplan
CEO, TradeSmith