Three Free Stocks Inside!
I’m giving away three free stocks from our products this week.
Read on to get them. But please, don’t just take the tickers and buy. Instead, I hope you’ll take a little time to really understand why we think each is a “buy” right now.
If you tuned in last week, you can probably guess I’m talking about “factors.”
Factors are just the specific qualities of an investment responsible for its potential risk and reward. They’re the “reasons why” a particular investment does or does not perform well.
Just about anything can be a factor. Even simple things like a company’s name or its nominal share price can potentially influence its stock-market performance.
However, as I explained, research has found there are fewer than 20 unique factors that are highly predictive of how well a stock is likely to perform. And there are five in particular that we think every individual investor should be aware of:
- Value
- Size
- Volatility
- Dividend yield
- Momentum
I also told you that you don’t have to be a TradeSmith subscriber to benefit from these ideas. So today I’m going to show you some simple ways you can begin to use these factors to improve your investing.
But first, let me be clear…
While these ideas are simple, they aren’t always easy to follow.
So please understand… If you want to “go it alone,” you’ll need to be willing to put in some effort. And you’ll need access to a public financial database (like Yahoo! Finance) and some basic charting software at a minimum.
Ok, let’s get started with value…
As I mentioned last time, value stocks are defined as relatively inexpensive based on one or more common measures of stock valuation.
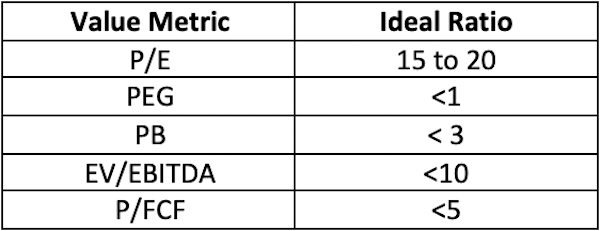
The most common is what’s known as the price-to-earnings (P/E) ratio. This is simply the ratio of a company’s share price to its earnings per share. It tells you how much you’re paying for every $1 the company earns.
Like other valuation metrics, there are few hard-and-fast rules when using the P/E. But there are a couple of general guidelines to keep in mind, too.
First, to be considered a “value,” a stock’s P/E ratio must be positive. By definition, if a company is not making a profit, its shares cannot be “cheap.”
Second, all things being equal, the lower the P/E, the cheaper the stock. In this case, “low” can be measured on both an absolute and relative basis.
By this I mean, a stock can be considered cheap if its P/E is simply below a specific level. Historically, depending on the industry, this ratio has often been in the range of 15 to 20.
However, in some situations, a stock might be considered cheap if its P/E is simply lower than that of other stocks in the same industry, sector, or the market as a whole.
For example, while fast-growing “software as a service” (SaaS) technology companies have historically never been “cheap” on an absolute basis, monitoring the P/E could help you identify when shares of specific companies have become relatively inexpensive versus the rest of the industry or the overall market.
A complementary metric known as the Price/Earnings-to-Growth (PEG) ratio can also be useful for assessing value in faster-growing companies. This ratio compares a company’s P/E to its earnings-per-share growth rate.
Generally, a PEG of less than 1 indicates a stock could be undervalued, and vice versa.
One of the favorite metrics of value investors is the price-to-book (P/B) ratio. This is the ratio of a company’s share price to its book value per share.
Book value — also known as “net asset value” — is just a fancy way of saying how much money you’d have left over if the company liquidated all of its assets and paid off all its debt.
By definition, a P/B of less than 1 is considered “cheap.” This means a company is trading for less than the value of its assets. But depending on the situation, “value” can include stocks with P/B ratios up to 3.
Another popular metric is the enterprise value to earnings before interest, taxation, depreciation, and amortization (EV/EBITDA) ratio.
This ratio compares a company’s enterprise value — which includes a company’s debt and cash levels along with its stock price — to a more restrictive measure of profitability. EBITDA is essentially how much of a company’s profits are left over after accounting for debt servicing, taxes, and certain capital expenses that are being accounted for over time.
Historically, EV/EBITDA ratios of less than 10 have generally been considered cheap.
Finally, the price to free cash flow (P/FCF) can be useful as well. This ratio compares a company’s share price with its free cash flow per share. In simple terms, free cash flow is how much actual cash is left over after a company pays for all its normal operating expenses and capital expenditures… things like payroll, rent, taxes, building and equipment maintenance, etc.
As a general rule, P/FCF ratios of less than 5 have historically been considered cheap.
To summarize:
All of these valuation ratios are typically available for free through most brokers and public financial databases, so you shouldn’t have much trouble finding them.
The next factor that can be useful for individual investors is size.
This factor refers to the market capitalization — or “market cap” — of a stock.
This is just the total market value of a company, calculated by multiplying the total number of a company’s outstanding shares by the current market price of its stock. And it is probably the easiest factor for most folks to understand and put to use.
In short, smaller-sized companies tend to outperform larger companies over time.
This should be intuitive to most folks. All things being equal, large companies simply can’t grow their businesses as fast as smaller companies. Smaller companies are also more likely to fly “under the radar” of big Wall Street banks. And this lack of attention may make them more affordable at times.
The “sweet spot” here is in what are referred to as “small cap” companies — generally those valued at between $300 million and $2 billion or so.
These companies are still small enough to enjoy the benefits I just mentioned but are typically far less risky and volatile than smaller, less-established companies.
Like the valuation metrics I just mentioned, market cap data is widely available for free through most brokers and public databases.
Next up is volatility.
As I explained last week, this factor turns the idea of “more risk, more reward” on its head.
Instead, research has shown that stocks with lower volatility tend to do much better than stocks with higher volatility over the long run.
They’re also much easier to actually own for the long run. Allocating a good portion of your portfolio to low-volatility stocks can allow you to sleep well at night, no matter what’s going on in the overall market.
Unfortunately, unlike most of the other factors I’ve mentioned, this one isn’t easily accessible for most individual investors.
There just aren’t any publicly available metrics that are as useful as the TradeSmith Volatility Quotient (VQ) — our proprietary measure of asset-specific volatility. Again, that’s why we created this measure in the first place.
But there are some measures that can be helpful in a pinch.
One is known as “beta.”
Beta is not a measure of an asset’s actual volatility.
Rather it’s a measure of an asset’s volatility compared to the market as a whole. For stocks, this is usually a benchmark index like the S&P 500.
A beta value of greater than 1 indicates a stock is more volatile than the market, while a value of less than 1 indicates a stock that is less volatile than the market.
The main benefit of beta is that it’s widely available for free through most brokers and public databases. However, it does have some big drawbacks.
The first is obvious. Unless you also know the volatility of the market benchmark, beta doesn’t tell you anything about how volatile a particular asset is likely to be in absolute terms.
Second, while beta can be useful for comparing the relative volatility of different stocks in the same market, this same limitation means it can’t be used to compare different asset classes or even stocks in different markets.
The closest thing to our VQ you’re likely to find is a “historical volatility.” This measure isn’t typically available in public databases, but most brokers do publish it for customers.
Historical volatility is a measure of the annualized standard deviation of an asset’s price over a specific period of time. In other words, it tells you how far prices deviated from their average over that time.
This metric is usually calculated over a 21-day period — which is roughly the number of trading days in a month. But you’ll sometimes see it calculated based on other time periods, from five or 10 days to as many 60 or 90 days.
While far from perfect, historical volatility based on these longer time periods can generally give you a reasonable approximation of the actual risk in a stock. (For reference, our VQ is calculated on as much as one year of price data.)
Just be aware that beta and historical volatility can still be influenced by big, short-term moves.
Our fourth factor is dividend yield.
This is another relatively easy one to apply.
Research has shown that stocks that pay dividends — especially consistently growing dividends — tend to beat both non-dividend-paying stocks and the overall market over time.
Like with value, the minimum acceptable criteria for this factor can vary depending on the situation. Here at TradeSmith we generally want to see a dividend yield of at least 2% that has also been growing for at least five years.
Last, but not least, is momentum.
As I mentioned last week, momentum is arguably the most important factor. I like to call it the “king of the factors.” And I hope you can see why…
Research has shown that a stock’s recent performance is typically the single strongest predictor of its future performance.
In other words, like the property of inertia in physics, stocks that have been rising tend to keep on rising… while stocks that have been falling tend to keep on falling.
Taking advantage of momentum is easy in theory…
No matter what else you do in your investing, you’ll generally do much better if you invest primarily in stocks that are currently performing well (in an “uptrend”) and avoid those that are currently performing badly (in a “downtrend”).
But it can be a little challenging to actually follow this advice in practice.
If you wait until a stock has traced out a clear and obvious uptrend on a price chart, you risk missing out on much of the potential upside.
On the other hand, if you buy in too early, you risk getting stopped out by “false breakouts” within a continuing downtrend.
And unfortunately, like the volatility metrics I mentioned earlier, none of the commonly available momentum tools do a great job of “threading the needle” between these two problems.
Again, this is exactly why we created our TradeSmith Entry Signal and Early Entry Signal… To help investors buy into uptrends as early as possible, while still minimizing the risk of getting stopped out prematurely.
However, momentum is such an important factor, it can still be useful to employ some basic tools, even if they are less than ideal.
The simplest of these is the “eye test.”
Can you identify a series of higher lows and higher highs on a price chart? Have prices been respecting any obvious trendlines or areas of support (price “floors”) or resistance (price “ceilings”) that could strengthen or weaken the chances of a continued uptrend?
Moving averages can also help you identify trends.
For example, research has shown that simply buying when the market closes above a long-term moving average — like the 200-day moving average or 10-month moving average — and selling when it closes below, can produce better long-term returns than buying and holding.
Now, there’s nothing special about these two moving averages. They’re simply reasonable approximations of the long-term trend of an asset.
Depending on your risk tolerance and investment approach, you might choose to use a moving average based on a longer or shorter timeframe.
Generally, shorter moving averages will get you into a potential uptrend sooner than longer moving averages. But they will also expose you to a higher risk of getting stopped out prematurely.
I would also suggest testing different moving averages on different stocks. Depending on the price action of an individual stock, you may find that one moving average tends to define its trend better than others.
In fact, this is actually a big part of the algorithm behind our TradeSmith Entry Signals. We use a “Smart Moving Average” that is specifically tailored to each asset’s price history.
We’ve covered a lot today. But I want to leave you with one more thing…
As I mentioned last week, the real “magic” of factor investing begins when you begin to combine multiple factors in a single investment.
At a minimum, I would encourage you start including momentum in every investment you make…
If you’re interested in value stocks, look for value stocks that are performing well rather than those that have been “left for dead.”
If you’re interested in dividend growers, you’ll do much better over the long run if you look for those that pay big, growing dividends AND have been performing well.
You get the idea…
This one change alone can make a huge difference in your results. And the more positive factors you can use, the better your results are likely to be.
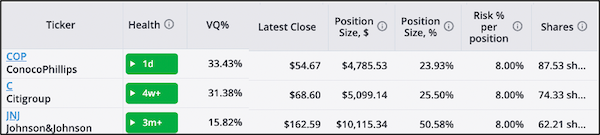
As promised, here are three high-potential stocks that are part of our factor-based investing strategies from our products.
Each of these stocks meets at least two of our favorite TradeSmith factors… and as I hope you can guess by now, each has MOMENTUM on its side as well.
All three are in healthy uptrends and are considered a “buy” in our system today.
I even ran them through our Pure Quant Portfolio Builder to equalize the risk for you.
Enjoy!