Monitoring Your Portfolios During a Downturn

By Lisa Lenda

As a TradeStops member, you know our mantra is to always have an exit strategy. One powerful exit strategy is to focus on the overall state of your portfolio by using the Portfolio Volatility Quotient (PVQ) Analyzer tool.

If you have a long-term portfolio that’s sitting on large unrealized gains, it can be difficult to monitor the historical high-water mark — and hence a true picture of the portfolio’s health. Here’s a solution we touched on in last week’s webinar focused on Portfolio Exit Strategies that can help many investors know where they stand during a market downturn.

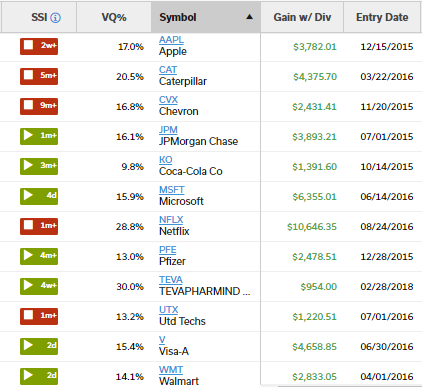
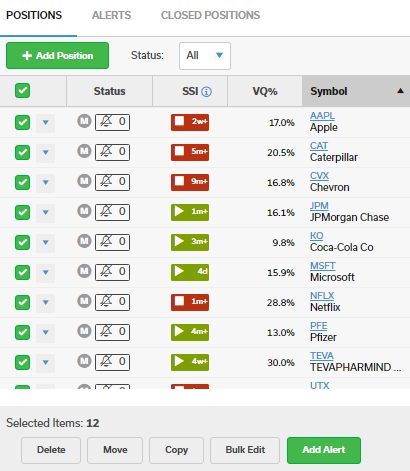
The following chart shows a sample portfolio we’ve used during many of our presentations. We’ve held some of the stocks in this hypothetical portfolio since 2015. Even though five of the 12 positions are in the Stock State Indicator (SSI) Red Zone as of this writing, all of the positions are profitable.

Sample portfolio with many profitable positions in SSI Red Zone
And the total value of the portfolio is up by more than 70%. It can be difficult to make a sell decision with this kind of success.

Overall total gain of sample portfolio is positive
But we all know that at some point in time, a market downturn can destroy this or any other portfolio. If you’re hesitant to follow the SSI alerts for a position that is still profitable, you could instead consider using the Portfolio Volatility Quotient (PVQ) as your exit strategy.

The reason this makes sense is because when some stocks are moving lower, other stocks in the portfolio could be moving higher. But if the overall portfolio drops by more than its normal volatility, it becomes an easy decision to sell everything and move to cash. Think of it as a red zone alert for your entire portfolio.

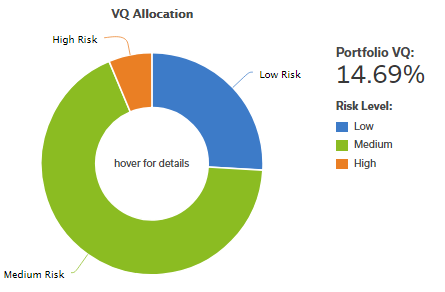
Using the PVQ Analyzer tool, we can see that the normal volatility of our sample portfolio is 14.69%. For risk management purposes, this means the overall portfolio must drop by more than 14.69% for us to exit the entire portfolio.

PVQ for sample portfolio is 14.69%
In TradeStops, we currently don’t track a portfolio’s historical value, and hence it can be difficult to follow the PVQ stop out point, but there’s an easy workaround. We can use the date of the portfolio’s high value (as determined by our broker) and create a duplicate portfolio using that date as our starting point.

You can go to your brokerage firm’s website and probably see the value of your portfolio on a day-by-day basis. If that’s not available, you can look at your month-end statements, find the highest value, and use that as the starting date.

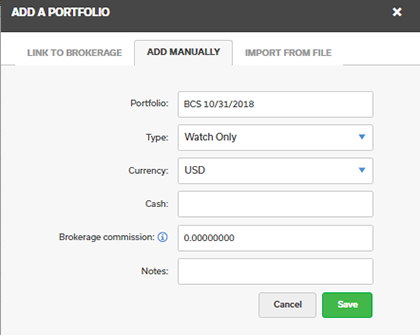
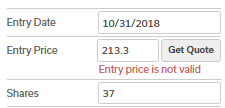
Then, we’ll create a Watch portfolio. The name of our sample portfolio is BCS Portfolio. I’ve determined that I want to follow the results of this portfolio from Oct. 31. Therefore, I’ll name the new Watch portfolio “BCS 10/31/2018”.

manually add a new watch portfolio
Once we’ve created the new Watch portfolio, we’ll copy the positions from the original portfolio into the new one. This is really easy to do. Just check the box at the upper left of positions page on the original portfolio and then click “Copy” to move the positions into the new portfolio.

copy positions from one portfolio to another
Once this has been completed, we’ll need to change the initial date of each position to 10/31/2018. To do this, just click on a position (the example below is for AAPL) and then click on the pencil icon in the new page. This will allow you to change the entry date to the date we want as the new starting point. Don’t forget to also click on the “Get Quote” button so that you have the correct entry price; otherwise you will get an error message like the one shown below.

adjust entry date and price for each position
Once you’ve made these two changes, click the “Save” button at the bottom of the page. It will take a few minutes to change all of the positions, but after the update is complete, you’ll have a much clearer view of your portfolio.

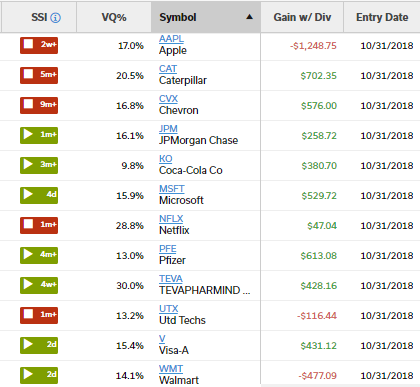
Now you can see what’s happened within our sample portfolio since Oct. 31. Yes, AAPL and WMT have lost money, but those losses have been more than made up by gains in CAT, CVX, MSFT, and PFE. There are nice gains elsewhere as well.

updated view of positions in sample portfolio shows some with a loss, but more with a gain
This portfolio is up a little more than 2% in the last month. It was actually down for most of the month, but last week’s powerful rally put it back in positive territory.

Portfolio value for new watch portfolio is up 2.12%
I’m writing this on Nov. 30. If this Watch portfolio closes the month in positive territory, we might want to consider going in and changing the dates for each position to 11/30/2018 and then following the market fluctuations from that date. Then, if the market does move lower, we’ll be tracking the results from the portfolio’s most recent high value.

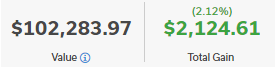
This Watch portfolio makes it really easy to follow the current portfolio movement from the date you determine is the top value of your portfolio. If the market does turn lower, it will be easy to know when the total loss based on the PVQ has been reached.

Cheers,

Tom Meyer
Research and Education Specialist