You Need to Look at This Apple Chart
Apple is the largest public company in the United States.
It has a market capitalization north of $2.4 trillion.
It represents 6.32% of the weight on the S&P 500.
And it’s 11.73% of the Nasdaq 100 (or the QQQ).
Apple has pretty much pulled the S&P 500 to an all-time high recently despite a broader sell-off and sideways trading of the hundreds of other stocks on the index.
Now the stock is looking quite expensive.
I want to show you a stunning chart.
More importantly, I want to talk about approaching Apple now that its earnings report is about a week away.
Apple Continues to Run to New Highs
Let’s take a look at Apple’s stock price. Shares are trading north of $147 after a slight pullback from a 52-week high of $150.00.

But pay very close attention to the Relative Strength Index (RSI). This is the line at the bottom, under the price chart.
The RSI is a momentum metric that tells you the strength of recent price changes to a stock. The indicator, developed by J. Welles Wilder Jr., ranges from 0 to 100 on a single line chart. Thus, it tells us when a stock is overbought or oversold.
When the RSI is above 70, a stock is considered overbought.
When the RSI is under 30, a stock is considered oversold.
This week, Apple climbed to $150.00 per share, and the RSI surpassed 72.
The last time that Apple had this much strength was August 2020. As you can see in the weekly chart, the stock pulled back in September of last year when the stock traded at an RSI above 70. The same happened near the end of 2019, when the RSI moved well above 70. A pullback ensued.
In both cases, we saw a sustained rise above 70 for at least two months. A pullback happened shortly after. How should you trade a stock that has this much momentum?
Here’s How to Trade Apple Stock
When market momentum and RSI are high, we have excellent conditions to pick off as much additional income as possible.
One easy way to do this is to sell what is known as a covered call.
In this situation, you sell one call contract on a predetermined date (the strike date) at a predetermined price (the strike price). I have discussed how to trade covered calls at length in previous posts. But using elevated RSIs to determine when to sell covered calls offers another way to boost your income off existing positions.
If you own 100 shares of Apple, you could sell one call option for this Friday’s expiration. The July 23, 2021, $150 call traded last Friday afternoon for $1.12. This means that you could sell the call option for $112 total, and it would give you additional upside from the stock price of $148.00 on Friday afternoon.
If the stock climbs to $150, the person who purchased the corresponding call contract would have the right, but not the obligation, to buy all 100 shares by Friday’s expiration date.
If the stock fails to reclaim the $150 level, you will pocket the full premium.
The worst-case scenario is that you make money. Your upside would be $2 per share plus the additional $1.12 for each share from the options premium.
That represents a potential upside of 2.1% in a week from the $148 price.
Lock Up Your Trailing Stops
Remember, if the stock does climb above $150, you can always purchase the stock back at any time, preferably when the RSI is much lower. And keep in mind that earnings season is always a time of increased volatility for stocks.
With earnings approaching, now is the time to ensure that you have your trailing stops in order. A trailing stop removes the emotion of the market and will advise you, after the market closes and the stock has reached a specific stop price, to sell your shares.
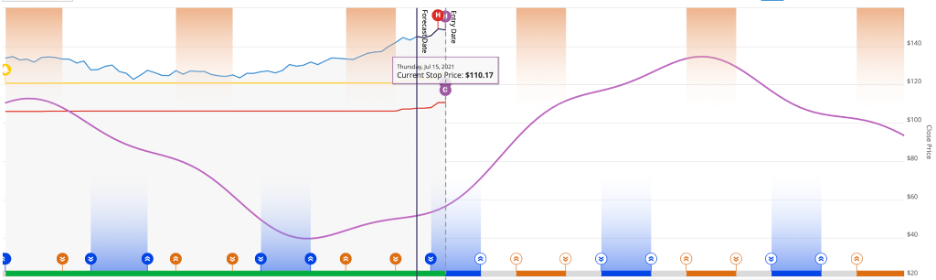
The current trailing stop for Apple is $110.17 based on our Health indicator, or 25.8% lower than today’s current price.
Remember, every stock has a different historical volatility level. So, you want to ensure that you have a specific, custom trailing stop for every stock in your portfolio. For example, some stocks might have a Risk (Volatility Quotient) or trailing stop of 15% based on their historical volatility, while others might have a sky-high risk of more than 50% (Tesla’s VQ is 52.8%).
Ahead of earnings, trailing stops are always essential. We don’t want any surprises, and we don’t want to be overly emotional about any move in our favorite stocks.
We’ll talk more about Apple as the earnings date approaches on July 27. Wall Street anticipates that the company will report earnings per share of $1.00. JPMorgan Chase is very bullish about the company, with an average price target of $175 over the next 12 months.
We’ll watch what happens. But in the meantime, we can generate some income off our current position with its price gaining so much momentum. And we always want to be protected from any sudden surprises.
Enjoy your Monday,
Keith Kaplan
CEO, TradeSmith