Our Most Important Research
Back in June, we published one of our most important pieces of research of 2016 … how to crush the S&P 500 using just the S&P 500 … plus the TradeStops SSI system. The simple system we published back then beat the S&P 500 by 2 to 1 … and did so with less than half the risk!
The team recently applied our more recent groundbreaking research to that study to see the impact. We weren’t disappointed. Trust us, you’re really going to want to see this.
The original study had been prompted by a challenge from one of our subscribers who wanted to know how our Stock State Indicator (SSI) system performed on the S&P 500 vs. a simple buy and hold strategy.
Here is the main stock market indicator takeaway chart.
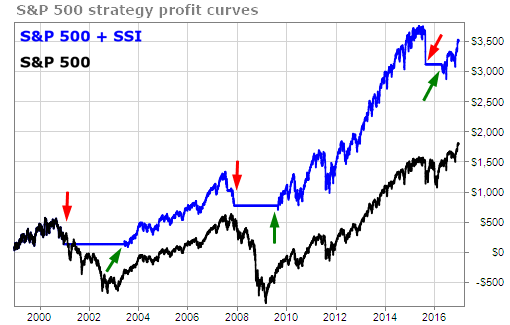
The outperformance of the SSI system here comes entirely from being out of the market during the 2001 – 2003 and 2008 – 2009 periods. The system was also out of the market for a few months in 2015 – 2016 but it lost a little ground by being out of the market during this period.
OK. That’s the backstory. Now… there are two pieces of our most recent research that the team applied to the original study. The first one is the research we did on how increases in volatility (rising VQ’s) can be used as an additional buy indicator.
In the chart below we can see how in both 2003 and 2009 the VQ on the S&P 500 did indeed increase nearly 100% or more above its long-term average of 10%.
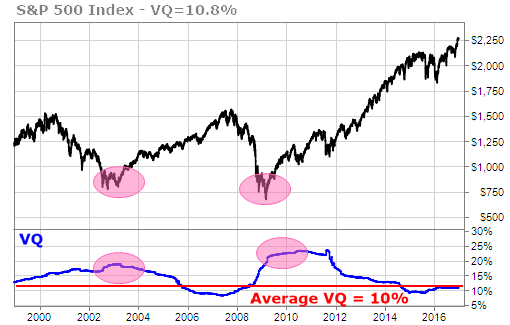
We do want to point out that applying the research above to our SPX + SSI system did not have any impact on the results that the system produced. At this point, it is just interesting to see how significant increases in VQ often precede long-term rallies. The final application of this research still remains to be uncovered.
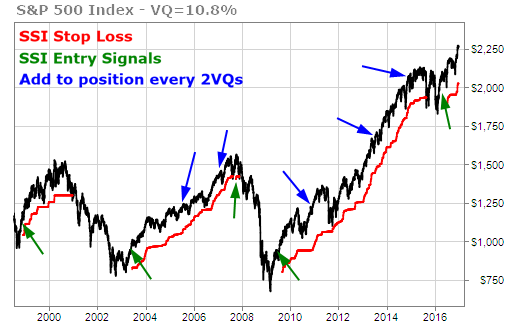
On the other hand, the second piece of research the team applied had a decisive impact on the results. The research in question is our study on when to add to a winning position.
The upshot is to add to a winning position after every 2 VQ’s of gains.
The chart below shows how that looks on the S&P 500. The green arrows are the initial SSI entry points and the blue arrows are points at which we added additional legs to the winning positions.
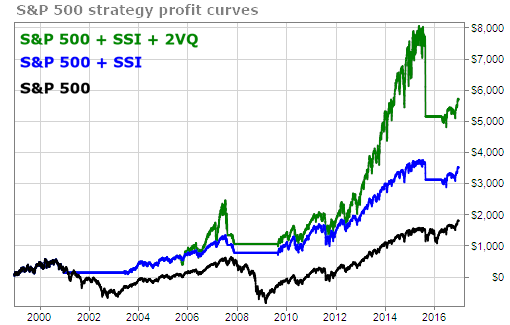
What really excites me about this, besides the obvious profit potential, is that it all perfectly captures my fundamental behavioral insights on investing.
- We have a bias towards our losers that is hard to see at first and even harder to overcome. We have to learn to cut our losses… and stay in our winners. Even the simplest of trailing stop strategies can help us accomplish this. Our volatility-based trailing stop strategies do it better than anything else I have seen.
- The stock market has momentum. What goes down often keeps going down and what goes up often keeps going up. It’s not true all the time but it is true more often than not. It’s better to add to winners than it is to add to losers.
- It’s best to decide how much to invest based on how much we’re willing to lose if we’re wrong rather than on how we feel about the investment.
- The stock market can stay irrational longer than we ever expect. It’s better to limit the role that our thoughts and feelings have upon our decision making. (Note that I said “limit” rather than “eliminate.”)
That’s all folks. 15 years of research and 200% alpha … all grounded in fundamental truths of behavioral finance that you can take to the bank.
Happy New Year!
TradeSmith Research Team