Stocks Are Actually Overbought – But That Doesn’t Mean What You Might Think
The January Barometer is not a measurement telling us how cold and snowy the weather has been for much of the country.
It’s a theory first proposed by Yale Hirsch, founder of the Stock Trader’s Almanac, that says how stocks perform in January sets the tone for the year.
To some degree, that’s common sense. As they say, “First impressions are lasting impressions.” And with stocks moving higher about 70% of the years since 1945, January’s performance correlates with the market more than 80% of the time.
It’s hard to believe that we’re more than halfway through January already, and the S&P 500 is up 0.04%.
Good luck trying to spot a trend in that.
More importantly, stocks are still stuck in 2023 when it comes to one thing: my proprietary Big Money Index (BMI).
The BMI is what it sounds like – a measure of what Big Money is doing. It calculates all the Big Money signals picked up by my system in the daily data – all the unusual buying and selling of stocks and ETFs – and plots them on a 25-day moving average.
It is a fantastic proxy for unusual money flows – the money flows that move stocks. It’s unique, unavailable anywhere else, and stunningly accurate at pinpointing the market’s pivot points.
In the huge rally to finish off 2023, the BMI rose all the way into overbought territory (the red dotted line) on Dec. 14. It’s still overbought exactly five weeks later.
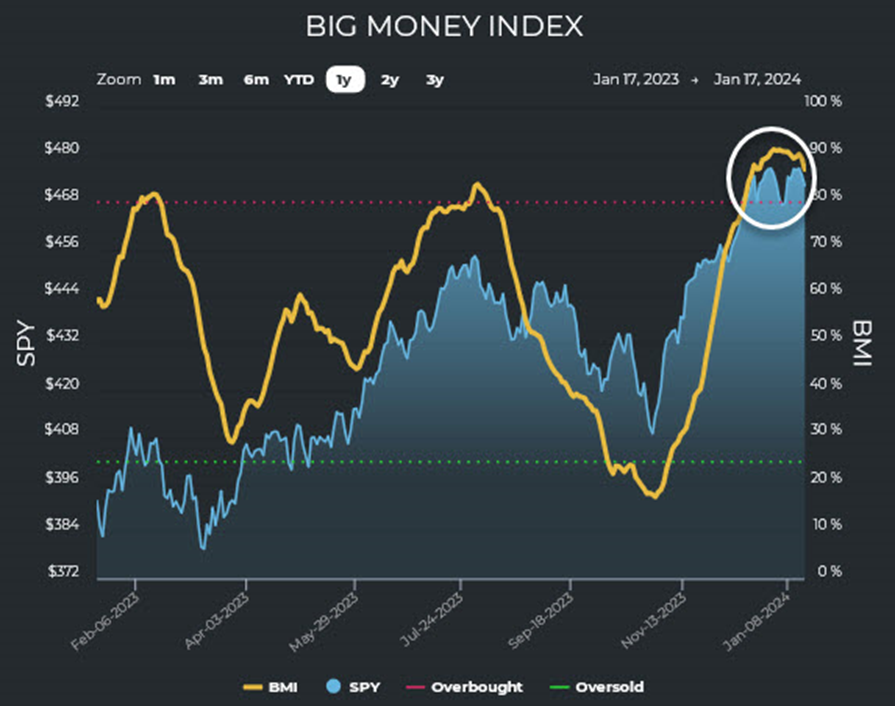
Source: MAPsignals.com
That’s a strong market. With the BMI currently at 87, it means that 87% of unusually big trades sniffed out by my system are buys – so just 13% are sells.
But when you hear “overbought,” you immediately think pullback, right? And that’s not wrong. We know that buying can’t always outpace selling by nearly 9-to-1. At the same time, it doesn’t mean an all-out crash, and it doesn’t even mean a dip is imminent.
That’s why an overbought BMI is not a signal to sell stocks. It matters not when the BMI becomes overbought but when it falls from being overbought.
And here’s the most important thing: The BMI can stay overbought for a long time, especially after deeply oversold conditions. And we saw those conditionslast Octoberafter three months of volatility and whipsawing.
It reminded me of the BMI during 2020 when COVID shut everything down. Following the fastest descent into a bear market in history, the BMI and stocks rallied from March through early September. The BMI stayed overbought for a shockingly long period of 87 trading days – almost exactly 4 months.

Source: MAPsignals.com
There’s Money Out There, but Where’s it Flowing?
We normally expect volume to pick up after the week between Christmas and New Year’s, and that’s exactly what we saw. Those yellow bars on the chart below are the total Big Money signals (buys and sells) for each trading day. There was very little activity at the end of December, followed by a marked increase at the start of this year.
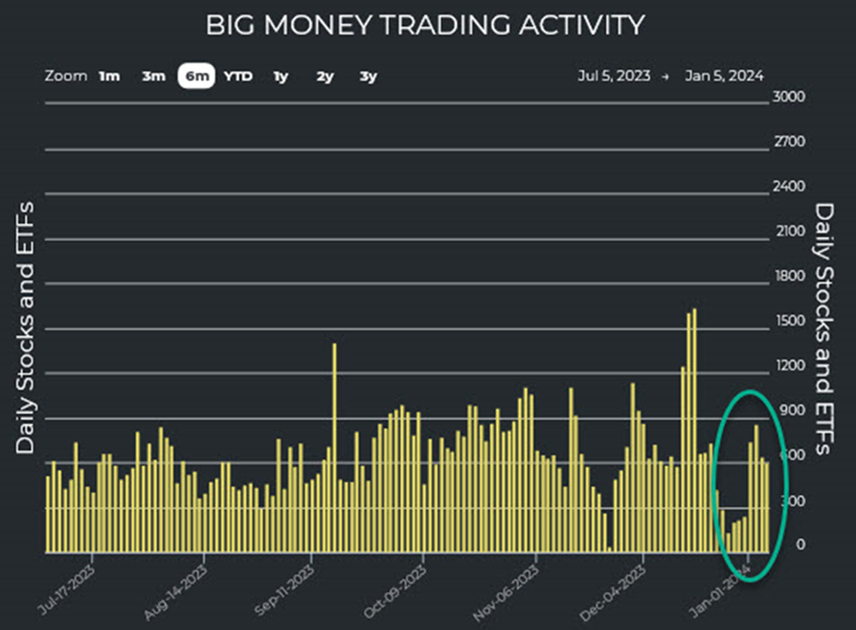
Source: MAPsignals.com
It makes sense. Portfolio managers start repositioning their holdings for the year ahead, and many investment companies require capital to be deployed when the calendar flips to a new year. Remember: Money managers don’t earn fees if they are invested in cash.
That’s why the record amounts of cash – what I call the “cash bubble” – is setting up to be a major catalyst to power stocks higher, especially as we get more clarity on when the Federal Reserve will start cutting rates.
And where is that money flowing? The bulk of the buy signals I’m seeing are in small- and mid-cap stocks, which typically do well in stronger markets. Encouragingly, large-caps also attracted Big Money inflows.
The strongest sector since Jan. 1 is Health Care, with 38.2% of all Big Money buys. That’s significantly higher than the runner up, which is Technology with 13.3% of buys. This is especially interesting in a presidential election year, when Health Care stocks typically perform very well – especially in the first quarter.

Source: MAPsignals.com
So while stocks in general have gotten off to a ho hum start in 2024, the market’s underpinnings continue to look good. Buying is stable. Selling is low. And we’re in a strong market that can stay overbought for a while.
I do expect volatility at some point, but there are good buying opportunities out there right now with those rare stocks with strong fundamentals and technicals that Big Money is flowing into. For example, our newest buy in TradeSmith Investment Report has gained 8.5% in two weeks.
And any pullbacks – whether they come stock by stock with the market as a whole – should be great opportunities to add more such stocks for what I expect will be a strong 2024.
Inflation and interest rates are coming down. The job market is healthy. Consumers and businesses continue to thrive. And election year trends indicate some ebbs and flows in the next few months but a strong likelihood of higher prices by the end of the year.
And I’ve mentioned the record amounts of cash on the sidelines. As stocks strengthen and interest rates make cash-related investments less attractive, this cash bubble is about to pop.
I’m not sure the January Barometer tells us much this year. But what we could call the Quantitative Barometer sure points to big profits ahead if you’re in the right stocks.
Talk soon,

Jason Bodner
Editor, Jason Bodner’s Power Trends