The Biggest Stock Buyback Ever
Another tech stock turned value… The Fed’s “taper tamper” is a sign they’re giving up the fight for 2%… The 3 most-searched stocks on TradeSmith and which ones you should buy… Jonathan Rose went 7-for-7 and he’s just getting started…
By Michael Salvatore, Editor, TradeSmith Daily
Apple (AAPL) reversed its fortunes with Thursday’s earnings report… and furthered the trend of the tech giants turning into value plays.
The highlights:
- Apple’s revenue last quarter came in at $90.8 billion – better than expected, but still a drop from the previous quarter – which we can attribute in part to a sales recovery from the difficult China market.
- Earnings per share ($1.53) also beat Wall Street expectations ($1.50).
- The quarterly dividend rose 4% to $0.25 per share, its fourth consecutive dividend raise since the company slashed its dividend by 75% in 2020.
- And the headline number: a $110 billion share repurchase plan over the next year. The biggest share repurchase of all time.
Let’s stay on that last item, because it represents a fast-growing trend in the mega-cap tech space of transitioning from growth to value.
With its biggest-in-history $110 billion buyback program, Apple (AAPL) will spend nearly $20 billion more than what it made in revenue last quarter on share repurchases for the next year. That’s also 11 times more than it spent on capital expenditures – investment in the business itself – last fiscal year.
Apple has a ton of cash on its balance sheet. This latest report revealed it’s sitting on $73 billion and has annual cash flows of $86 billion. It can afford the share buyback, large as it is.
But the fact that so much more is going into purchasing stock than R&D is a testament to a tapering of growth in this former fast-moving tech giant. Innovation and disruption are simply not a priority for this company anymore. Rewarding shareholders and holding its position as the pinnacle of U.S. consumer tech is.
It’s not a bad thing, to be clear. Trees don’t grow to the sky forever. It’s just worth reassessing where we should seek fast-growing companies.
❖ Jason Bodner’s Quantum Edge Pro system is a great place to look…
As regular readers know, Jason’s approach is all about finding the small- and mid-cap companies growing revenue and earnings, trading in uptrends, and being bought by large institutional investors.
When you quantify the stock selection process this way, it becomes dead simple to find the potential fast growers of the future.
That third factor is most important. Institutional interest is like a golden seal of approval. These big-time investors have the analytical firepower and connections that most investors simply don’t.
If we have evidence to suggest that a lot of money is flowing into a stock at one time, we have to pay attention to that. Jason has shown time and again how the presence of big money supports stock prices.
And when we filter out everything that sees this level of activity but isn’t top-notch quality, you have a winning formula in play.
Let’s take a look at the top 10/bottom 5 rankings that Jason sent to his subscribers last week. (Subscribers can expect a fresh list by the end of today):
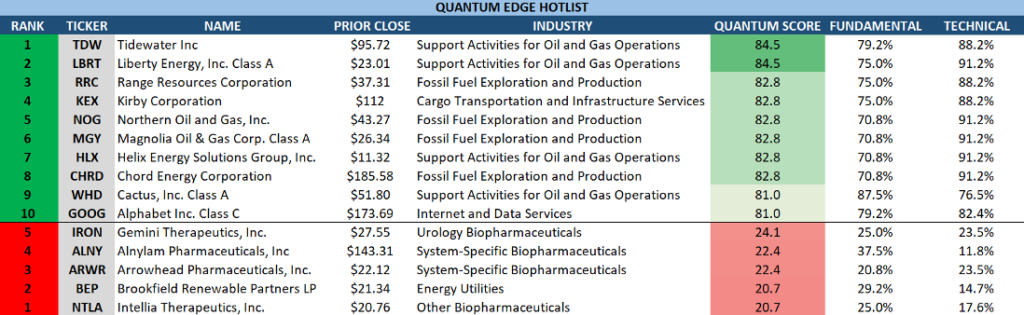
Just as with last week’s list, we can see a ton of energy presence here. We can see that eight of the top 10 in last week’s list were in oil & gas explorers, producers, and servicers. It should be no surprise with energy’s recent outperformance, but the continued buying suggests a longer-term trend in place.
The two outside that fold are cargo transport company Kirby Corporation (KEX) and Google (GOOG), which needs no introduction.
Meanwhile, some of the lowest-ranked stocks on the list are in the biopharma realm, which is noteworthy. Some of the best-performing stocks in 2024 have been in the biotech space. The fact that we see a combination of poor fundamentals, poor technicals, and low institutional support could be a sign that the rally has run its course.
This simple ranking is such a highlight of my week as an investor. I can immediately see where Wall Street institutions are likely placing their chips – both in individual stocks and in broader trends. This time, it was particularly clear, because you don’t often see one sector “sweep” either list this way. So, that’s a signal to investigate further.
❖ The Fed’s meeting last week was almost a non-event, except for this…
As slowly became consensus over the last few months, the Federal Reserve held interest rates firm at last week’s meeting. That’s its favorite lever, interest rates, and this time declined to pull it.
But it did pull its other lever – the “money creation and destruction” lever. Let me explain…
As we’ve covered before, the Federal Reserve has two primary tools for managing liquidity in the U.S. economy.
- By raising and lowering its key interest rate, the Fed guides the price of credit throughout the economy for lenders and borrowers.
- By either buying Treasury bonds… or letting them mature and roll off its balance sheet…the Fed can create and destroy money.
In the latter case, the Fed “prints” money which it uses to buy Treasury bonds and other assets from U.S. banks. Those banks then keep the proceeds in reserves – and now there’s just more money in the system. This is also known as “quantitative easing,” and was the Fed’s policy for many years after the Great Financial Crisis.
Once the bonds mature and the money goes back into the federal ether, that’s “quantitative tightening.” It’s removing money from the financial system.
Since the pandemic struck in 2020, the Fed has added a net $3.2 trillion of liquidity into the financial system. Yes, that’s the net amount after the wind-down that started in 2022. Thus far, that’s removed about $1.7 trillion from the system.

Since the peak, barring a short-term spike in reaction to the Silicon Valley Bank failure, the Fed has been drawing down its balance sheet at a cap rate of about $95 billion per month ($60 billion of Treasurys, $35 billion of mortgage-backed securities). At that rate, it would’ve taken the Fed just 33 more months to bring the balance sheet to pre-crisis levels from here, getting there in February 2027.
But now, it’ll take a lot longer. The Fed announced last Wednesday that its cap for monthly balance sheet runoff for Treasurys will drop by more than half, from $60 billion to $25 billion (mortgage-based securities are staying the same, for now). Assuming the Fed stays at this new rate, it will now take 58 months to get back to pre-crisis levels – putting the roundtrip destination in March 2029.
What does this all mean?
Slowing the rate of QT has two key effects. First, it’s a de facto interest rate cut – albeit a small one. More bonds held by the Fed for longer means less pressure driving bond yields higher. More money in the banking system has much the same impact.
And this leads to the second effect, a broad boon for riskier asset prices – lower bond yields mean less “competition” from other asset classes.
Beyond this, though, it’s also a sign that the Fed’s commitment to the inflation fight isn’t as strong as its commitment to supporting the economy. The higher the balance sheet, the more money flowing through the system… which contributes to inflation. And even if the balance sheet isn’t going up, a slower runoff means longer-term support for the system that’s in part driving inflation.
We cover these macro events with due care in TradeSmith Daily, but our advice for what to do remains simple and stalwart.
Own high-quality, dividend-paying stocks… own a smaller hedge against inflation via sturdy assets like gold, bitcoin, and other commodities sectors… and be ready to trade the short term in the face of whatever volatile surprises the market throws at us.
❖ Ever wonder what tickers are getting the most attention here at TradeSmith?
Well, now you don’t have to…
Below is the list of the top-searched tickers on the TradeSmith Finance platform, as of Friday, May 3.

No big surprises here, especially with AAPL’s and AMD’s earnings reports closest in the rearview mirror. And it should also signal the broad ownership of these stocks among most investors.
Tech, despite lagging in 2024, is the single most widely owned sector among U.S. investors. It makes up over 30% of America’s retirement account, the S&P 500.
And it earns that. All of the stocks in that screen shot score above a 70 on TradeSmith’s Business Quality Score – a composite of key fundamental metrics.
If you’re looking for the highest overall quality among the group, though, you’re looking at Nvidia (NVDA). It earns a coveted 97 BQS and a Strong Bullish 96 on its Ratings gauge, the highest of the group in both respects.
We’ll continue to monitor the top-searched stocks for TradeSmith users and share them in this dispatch…
❖ To wrap up, did you catch my interview with CBOE pit trading veteran Jonathan Rose over the weekend?
If you didn’t, click here to check it out.
Jonathan and I dove into Treasury bonds, the Fed, Tesla, earnings trading strategies, and a whole lot more in our interview. It should give you a good idea of how much experience and knowledge he brings to the table.
And a couple months back, Jonathan launched Masters in Trading Live – a free daily livestream at 11 a.m. Eastern where he takes stock of the current market conditions and shares one free trade idea with viewers.
Among those trade ideas were seven “pound the table” recommendations … each of which turned out to be winners with an average return of 125% each.
It’s rare to go 7-for-7 as a short-term trader. But Jonathan has a secret weapon on his side.
We discussed it a bit in our interview.
It involves an unusual indicator that Jonathan’s trusted for years that clues him into which specific opportunities are of top priority to traders.
It’s what helped him make over $10 million throughout his career… with a huge $4 million chunk of that coming during 2008 – a year where many traders lost money.
Jonathan’s going live to share this secret weapon in a webinar airing this Wednesday, May 8.
And anyone who signs up for this event will have the chance for a limited-time, three-part training series from Jonathan that shows how you can immediately start applying his process to your own trading.
To your health and wealth,
Michael Salvatore
Editor, TradeSmith Daily