This Data Tells Us Stocks May Be Ready to Shoot Higher
When a doctor reads an x-ray, that physician doesn’t really need to know why a bone is broken to know the right way to treat it.
It doesn’t really matter if the patient was trying to be Superman on his kids’ backyard trampoline or makes millions of dollars a year getting banged around as a professional athlete.
The what – that broken bone – is more important than the why.
Honestly, the absence of that “why” can be a tough hurdle for folks to clear. It’s human nature to want that whole story.
That’s true of the storylines we come across in books… in movies… in those “true crime” tales that have become so popular these days.
It’s also true of the stock market.
If the market falls, investors want to know why. If a stock rockets, investors want to know why.
But you don’t always need all the answers to make money. And if you wait for them – if you let that lack of total clarity freeze you in place – the cost can be substantial.
Our Quantum Edge stock-picking system is a lot like an x-ray. Thanks to its massive data retrieval and analysis, we can peer below the surface and see what is really going on.
That “what” is Big Money, both buying and selling.
And the good news is that after disappearing for a while, buying has returned. The data suggests stocks are about to rally.
Tracking Big Money’s Footprints
Studies show that institutions – the biggest investors on the planet – account for 70% to 90% of daily trading volume on average. This is the money that moves stocks.
But I’m not interested in general Big Money trading. The real prize is tracking unusual buying and selling.
When an institution trades a stock “abnormally,” we can formulate high-probability expectations about the future.
Billion-dollar funds obviously invest huge sums of money, so they don’t want to broadcast to the world what they are doing. They try to buy the substantial number of shares they need as quietly as possible without disturbing the price too much.
Trust me, they pay brokerage firms big bucks to do exactly that. That was one of my jobs as a professional trader, so I was right in the middle of it.
But if they cover their tracks – or try to anyway – how do we see what they’re doing?
Sitting on the front lines of these mammoth trades, I learned what you might call the tricks of the trades. As a result, I know how to spot Big Money’s footprints, and I designed algorithms for my Quantum Edge system to pore through reams of data each day and find them.
Thanks to the system, unusual buying looks like these green bars on the chart for Tradeweb Markets (TW), one of our Quantum Edge Pro stocks.

Source: MAPsignals.com
Each green bar is like an x-ray telling us the what – “unusual buying happening right here!” You can clearly see TW’s price lift as green bars show up.
Big Money buy signals not only indicate when a stock might zoom, but when we aggregate all of them across the roughly 6,000 stocks my system tracks, we get indications about what’s likely to happen in the overall market.
And that brings us to some encouraging data: unusual buying has returned.
In fact, the last seven trading days before today showed significantly more buying than usual (orange box below). And in those days, buying outnumbered selling by 60% or more. For example, on Friday there were 80 buy signals to 46 sell signals.
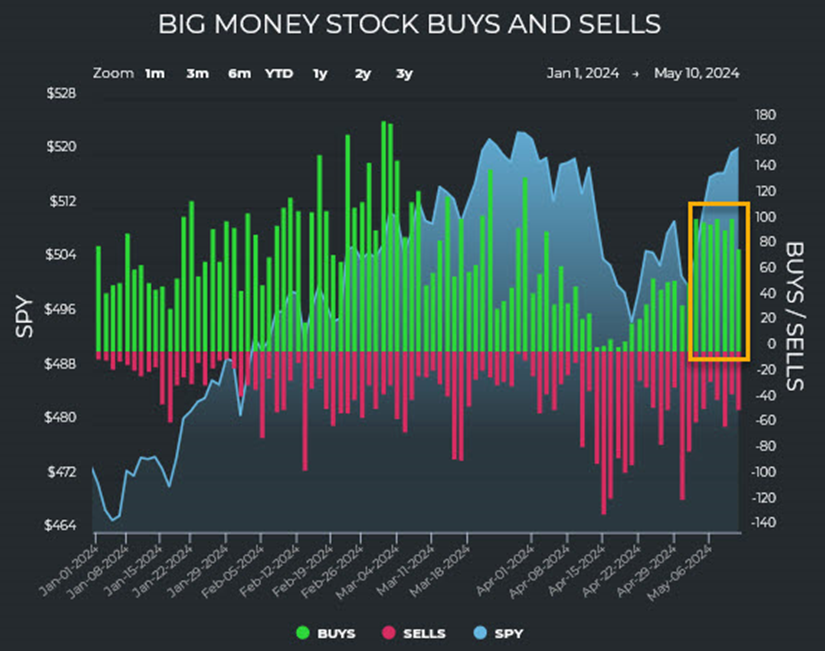
Source: MAPsignals.com
More good news: The buying appears to be “real” and not just a low-volume technical bounce.
Out of thousands of stocks, only about 100 or so show unusual buy or sell signals on an average day. Over the last seven days, we’ve averaged 141.1 total signals (buys and sells). This is substantially higher than the 34.5-year average of 85.1.
In other words, we’ve seen more signals than usual the last seven trading days, and buying is easily outpacing selling.
A string of consecutive buying days is generally bullish for stocks, and this latest streak lines up with other historical patterns. May is often a good month for stocks. June is a little less predictable, but July is surprisingly strong before we hit more bumpiness in August and September.
And as I mentioned a couple of weeks ago, my firm’s research shows we are coming out of a typically weak period (from roughly April 20 to May 20) before expecting a few solid months heading into the summer.
Leading the Way
Energy and Industrials are the strongest sectors right now, and our two newest stocks in Quantum Edge Pro are from those sectors. But looking back over the past seven days, I see buying pretty evenly distributed across sectors.
I also see quite a few new stock names among those getting bought, but I also see a slew of familiar high-quality names. These are the stocks with the highest probability of making you money – stocks with superior fundamentals, strong technicals, and those all-important Big Money inflows.
Look to buy companies with those qualities, or click here to learn more if you’d like my help.
The data is lining up to indicate stocks may be ready to rally again. We know the “what” – Big Money is buying again. And being able to see the stocks getting scooped up by the biggest investors on the planet is a huge advantage.
Talk soon,

Jason Bodner
Editor, Jason Bodner’s Power Trends