This Hot Sector Is About to Get Much Cheaper
|
Listen to this post
|
Lucas Downey, Contributing Editor, TradeSmith Daily
If you haven’t heard, utility stocks have been climbing at a breakneck pace lately.
Stories have been emerging that this value area of the market is benefiting from AI and the added energy use that’s benefiting power producers. I’m not so sure I’m buying into that narrative… but let’s give credit where credit is due.
Grandmas around the country are probably in for a welcome surprise once they check their brokerage statements. Because these “safe” utility stocks have been far and away the best-performing group as of late. As of Friday, they were even outperforming the S&P 500.
That said, a big overbought warning signal is flashing red for the sector. And history suggests this level of acceleration won’t persist…
Even worse, this steady-eddy group is set for a healthy pullback.
So, before you jump on the utility-AI bandwagon, consider these facts…
A Crowd-Stunning Run
Utilities are typically a deep value sector known for:
- Fat, slow-growing dividends
- Lower volatility, as power companies have predictable business year after year
When you buy utility stocks, you’re really making a stable income play. The group isn’t known for growth – it’s known for its recession-proof profile.
After all, one the last places a consumer will cut back is the light bill.
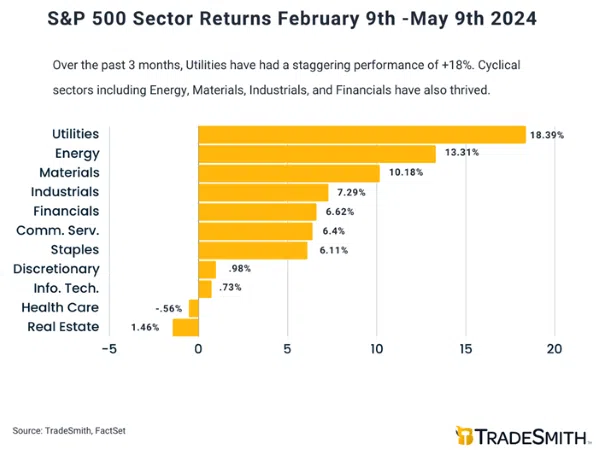
But in divine fashion, utility stocks have put in a crowd-stunning performance the last three months. Incredibly, the sector has leaped 18.39%, easily outpacing every other group.
Also notable is the flat return of 0.73% for information technology stocks over the same period:
Now, I’m all for betting on sector strength. I love a good trend.
That said… sometimes the momentum gets ahead of itself.
Momentum is one of the strongest indicators of the health and direction of a market. And one widely used momentum indicator that measures the overall relative trend of an asset is the Relative Strength Index (RSI).
Developed by mechanical engineer-turned-market technician J. Welles Wilder, this momentum oscillator measures the rate of change in price action. Most often, traders use the previous 14 days of data.
By using this framework, have a look at the RSI reading of the popular Utility Select Sector SPDR Fund (XLU). It recently eclipsed the 70 level.
I’ve also circled a few prior instances when this threshold breached:
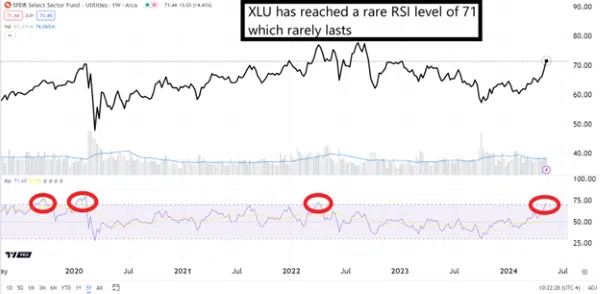
Now, it doesn’t take a genius to see that RSI readings of 70 or above rarely last. By the simple eyeball test, it appears that these nosebleed areas are ripe for a strong selloff.
You guys know we don’t make sector bets using our line of sight, though. We prove it with historical, evidence-rich data.
But before we shed light on that powerful study, let’s rewind the tape to when we told you to buy utility stocks with both fists back in October.
We noted the extreme selling back then, and made the call to buy the beaten-down group. Our research pointed to a potential 14.2% gain over the next 12 months.
XLU slaughtered those estimates with a mind-numbing 29% rip since that signal… a little more than seven months later.
For those keeping score, a 29% gain is bigger than the 22% lift for the tech-heavy NASDAQ 100 (QQQ ETF) and the 24% jolt in the Technology Select Sector SPDR Fund (XLK).
Yes, I’m taking a victory lap on that call. And I’m ringing the register on this overbought sector.
Where Utility Stocks Suffer
Data cuts through the noise. It offers an unbiased viewpoint that we shouldn’t ignore.
And the data’s telling us right now to cash in on utilities stocks.
I went back and pulled all weekly instances over the past 10 years when the RSI on XLU clocked in at 70 or higher. I also took the study a step further and calculated the average return for XLU in all periods over the last 10 years.
Basically, not only do I want to get an idea of what’s potentially ahead for XLU, but I want to contrast the expected returns with the normal behavior of XLU.
Including May 9, XLU’s RSI has risen above the 70 level 30 separate times.
Whenever that happens, this ETF…
- Falls an average of 3% a month later…
- Drops 4.1% three months after…
- And remains negative six and 12 months out.
Not only that, note how XLU typically has an upward-sloping return profile the longer you hold the ETF during all time frames (black bars).
These extreme RSI readings are powerful signals:
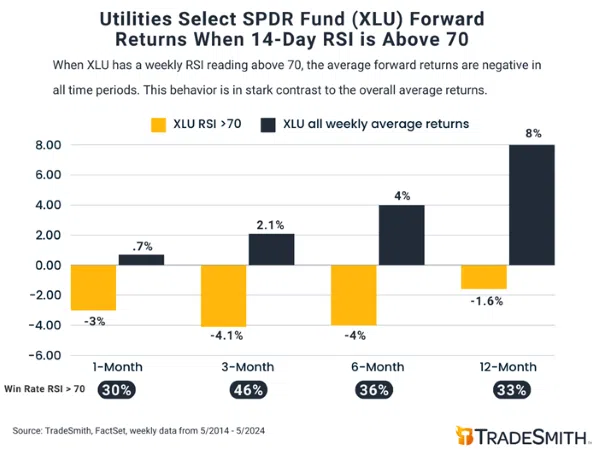
And to round out the “take profits” call, also see how the win rates for these extreme RSI readings are all below 50% in each time period.
While I hate to put out negative energy – this AI-anointed boost for utility stocks is one I’ll pass on. The sentiment is fully charged on this one.
This powerful analysis is proof of why having cutting-edge data at your fingertips will only improve your trading game.
And this is the kind of thing you can continue to expect from us here in TradeSmith Daily, day in and day out. Stay tuned for more…
Regards,
Lucas Downey
Contributing Editor, TradeSmith Daily