
How to Get Your Timing Right in Volatile Markets
What a difference a few weeks can make.
Just over three weeks ago stocks were on the ropes. The S&P 500 index (SPX) had dropped 5.5% at last month’s low, and investors were bracing for the possibility of a deeper decline.
Now, SPX is less than half a percent from making new all-time highs. Welcome to election-year volatility!
Today I’d like to provide some tips on buying the right stocks at the right time, because the market might not get off this rollercoaster ride anytime soon. As you can see below, between July and November of an election year, the CBOE Market Volatility Index (VIX) has historically spiked higher by about 25% on average.

Currently VIX is hovering around 13.3, meaning there’s plenty of upside for market turbulence between now and Election Day. So, don’t let your guard down.
It’s remarkable to see stock prices rebound so sharply lately … since not much has really changed fundamentally.
Inflation is still a question mark. And as a result, the Fed still appears to be on hold: reluctant to cut rates too soon with inflation still above its target.
One big positive is first-quarter corporate earnings reports, which came in well above expectations once again. However, top-line sales growth was relatively weak.
SPX companies are reporting revenues that are just 0.8% above analyst estimates, which is well below the five-year average of 2% sales growth.
So, all in all, mixed signals, including plenty of up-and-down swings in markets. Volatile markets put a premium on having your timing just right. And TradeSmith has plenty of indicators to help guide you in your trade timing.
Case in point, Predictive Alpha, our AI-powered algorithm for forecasting short-term stock moves. Our analysts and software developers spent six years developing this breakthrough tool that takes thousands of hard-data points (remember: just the facts, ma’am) including economic data, interest rates, and inflation… fundamental data like corporate profits and valuation ratios… plus, technical insights including relative price strength, moving averages, and pattern recognition…
And crunches all these numbers on nearly 3,000 securities (mostly stocks, plus a few dozen major ETFs). In a split second, Predictive Alpha ranks each security based on:
- The direction a security price is expected to move over the next 21 trading days, and
- The magnitude, or the percentage price change it’s expected to make in that time.
In this way, Predictive Alpha can show you, at a glance, where any stock is projected to be over roughly the next month, and it gives you an estimated price forecast right down to the penny.
That’s incredibly valuable information to have by your side, especially in volatile markets.
How to Use Predictive Alpha to Your Trading Advantage
In my last column I briefed you on another powerful TradeSmith algorithm, Harmonic Convergence, which is a combination of our cycles analysis, seasonality, and the Relative Strength Index.
You may remember that the screener results I displayed included the Predictive Alpha one-month projected price change. And none other than AI high-flyer Nvidia (NVDA) was right at the top of that list with a projected one-month price change of nearly 4%.
Now, for a stock changing hands around $900 a share as I write this, a 4% move may not sound like much upside potential. But instead of buying NVDA stock at $900-plus a share, armed with the same Predictive Alpha price forecast you could trade options on NVDA instead, which may give you a big edge at much lower cost.
Be sure you’re logged in to TradeSmith Finance. From the Dashboard (homepage), scroll down to the Predictive Alpha widget, shown below. Note, you must subscribe to Predictive Alpha Prime, TradeSmith Essentials or TradeSmith Platinum to access this data.
Next, enter the ticker, NVDA, into the search box and you’ll see the Predictive Alpha price projection and other stats as shown below.
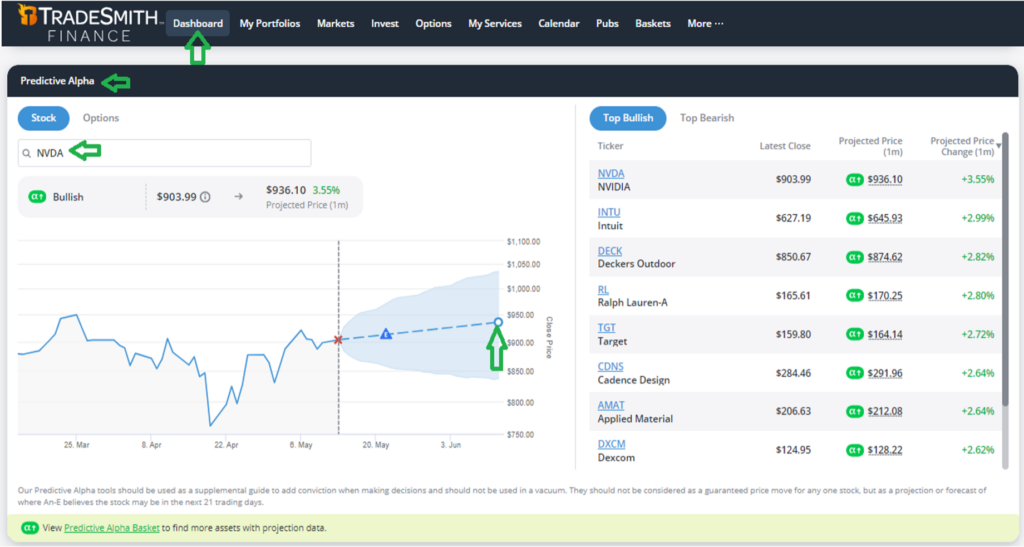
X marks the spot where we are now. The green arrow I added points to the one-month projected price of $936.10 for NVDA, up 3.55% from today’s price.
You can also see a list of other Top Bullish stocks at right, sorted by projected price, with NVDA at the top. Also, you have more choices. You can toggle over to Top Bearish to get the list of biggest loser stocks in terms of one-month negative projected price. But let’s stick with NVDA.
Notice also, at top left you can toggle between Stock and Options, so let’s click Options, which brings you to this data page.
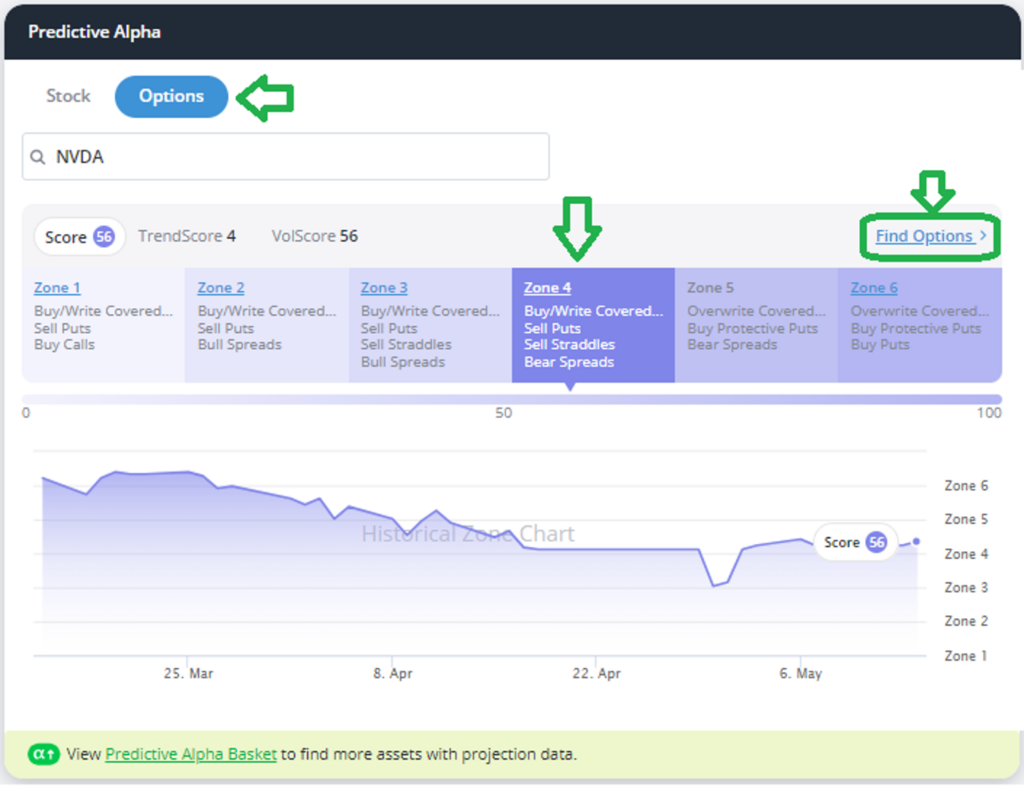
Our Predictive Alpha algorithm uses proprietary trend and volatility scores to determine what option zone is the best fit for NVDA (or any other stock) at this point in time.
Currently, NVDA falls into option Zone 4, as you can see above. That means now is an opportune time to:
- Buy/Write covered call options
- Sell put options
- Sell an option straddle, or
- Trade a bearish option spread
Next, click on the Find Options link at top right, and it will take you to any favorable TradeSmith Option Opportunities for NVDA. And sure enough, for NVDA you’ll find several Buy/Write Covered Calls to choose from, as shown below.
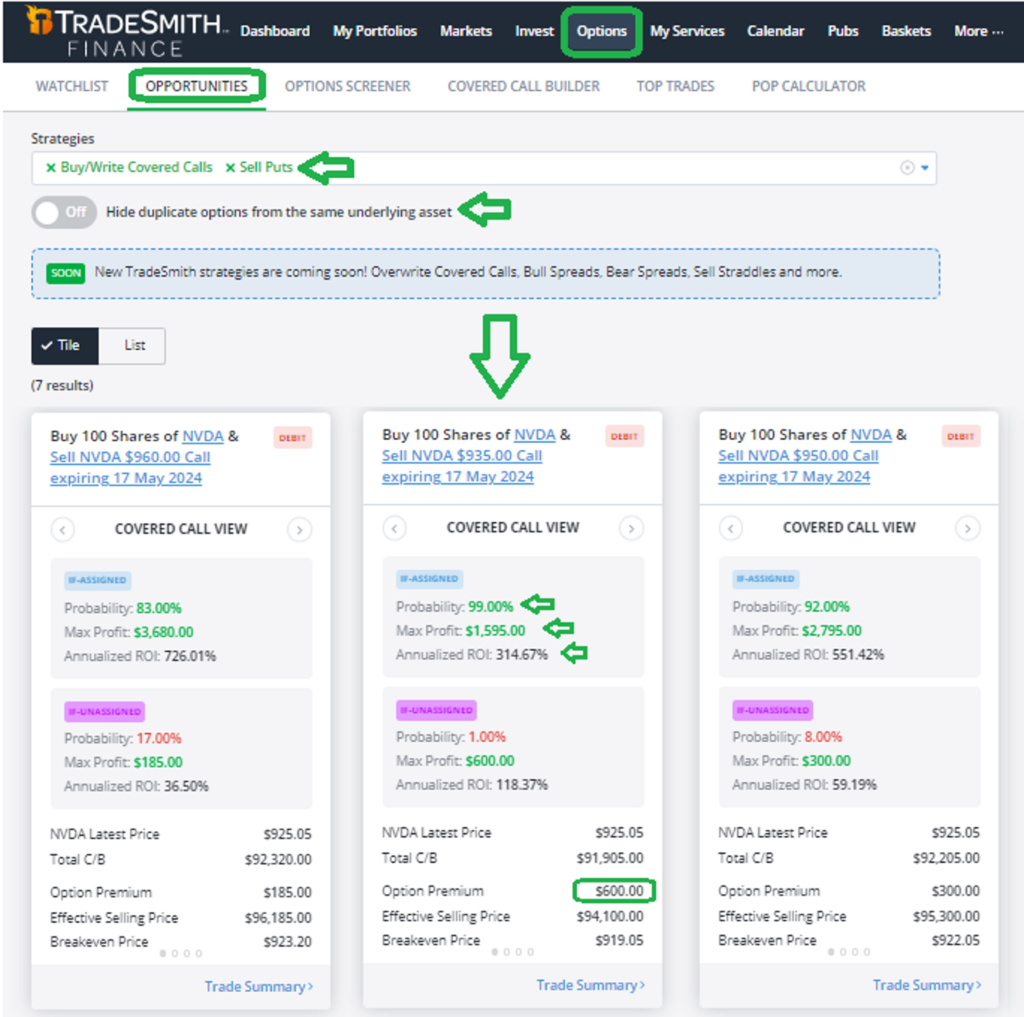
I marked with a green arrow the NVDA buy/write with the highest Probability of Profit (POP), but there are several other options. With NVDA trading around $900 as I write, here is what you’d do for the trade I’ve highlighted above.
Trade: Buy 100 shares of NVDA & Sell 1 NVDA $935 call option expiring 17 May 2024
Probability & Max Profit: 99% probability of earning a profit of $1,595
Annualized ROI: 314.67% per year, not too shabby
Also, notice the circled $600 of the max profit that comes just from the premium income you earn for selling the covered call option. So, even if your NVDA shares aren’t called away at expiration, you still get to keep the $600 cash premium earned.
Mike Burnick’s Bottom Line: Trade timing is critically important, especially in volatile markets like this. Our TradeSmith Predictive Alpha algorithm can help you uncover stocks with the best one-month projected price gains. Plus, our proven algorithms can help you to leverage your profit potential by finding the best possible option trades according to our Predictive Alpha Options Zones.
Mike Burnick
Senior Analyst, TradeSmith
P.S. Speaking of AI and Nvidia… you should know that the next big application of AI will be used to revolutionize a $13.1 trillion industry — one that has nothing to do with the self-driving cars or ChatGPT applications that have taken up all the headlines so far.
And this means that the next Nvidia, i.e. the next $1 trillion AI stock, will be found among an entirely different set of companies.
Eric Fry from our corporate partner, InvestorPlace, is preparing a free briefing on The Next $1 Trillion AI Stock now. He’ll also include the strategy he intends to use to help his subscribers make up to 40 years of Nvidia-like gains in a matter of months.
Sign up here to reserve your spot at Eric’s event, next Tuesday, May 21. That way, you’ll be sure not to miss his briefing…so, you’ll already be prepared before the next big AI announcement moves the stock market.