To paraphrase the old proverb: a butterfly flapped its wings over Tokyo – and it triggered a perfect storm on Wall Street.
That aptly sums up the unlikely series of events that led to the recent mini-market crash.
Two weeks ago, the Bank of Japan (BOJ) decided to raise interest rates for the first time in what seems like forever. The rate hike seemed harmless enough, moving from zero to 0.25%.
But that seemingly minor move triggered a violent unwind of the yen-carry trade. And that unwinding was felt around the world – especially on Wall Street.
Just to recap, the carry trade in question involves borrowing the Japanese yen, at a dirt-cheap interest rate, then selling it on to invest in higher-yielding securities.
This trade strategy mainly focused on buying U.S. Treasury bonds, which offer a significantly higher return. But the proceeds from the yen sales could just as easily be invested in other high-yield securities – such as the Mexican peso, junk bonds, or even the “Magnificent 7” tech stocks.
It was the perfect easy-money trade, favored by hedge funds worldwide… until it wasn’t.
The BOJ rate hike brought Japanese interest rates to their highest levels since 2008, and messaging from BOJ Governor Kazuo Ueda suggested that it could be just the first in a series of further rate hikes. So, the once-safe carry trade suddenly and violently unwound.
The Japanese yen soared nearly 8%, almost literally overnight. And if you’re familiar with the typically glacial pace of currency movements, then you know a move like that has the disruptive force of a Category 5 hurricane when it hits the financial markets.
Japan’s TOPIX stock index plunged 12% in a single day. Halfway around the world on Wall Street, the CBOE Volatility Index (VIX) soared from 20 to above 60 overnight. And the S&P 500 dropped more than 7% in just three trading sessions.
Who could have anticipated such a sudden spike in volatility – and such a sharp drop in stocks?
Well… our TradeSmith data did just that. And we discussed it back in May!
In an earlier Insider issue, I pointed out that our Trade Cycles tools forecast a sharp seasonal rise in market volatility from July through October – a rise that typically occurs during election years.
I also explained that our Seasonality and Trade Cycles tools suggested a stock market decline coinciding with this spike in the VIX. And we just saw that decline – and the rebound from the lows – play out over the last two weeks.
To briefly recap, our Seasonality tools help you understand when certain assets – or measures of volatility – are generally set to rise or fall throughout the year.
That gives you a good idea of the historical trends, to keep you prepared for what may come next.
Our Trade Cycles charts, meanwhile, give you a similar forecast – but on different time frames. With it, you can see when stocks are set to make short-term tops and bottoms.
And when the cycles patterns converge with seasonality patterns, with both pointed in the same direction at the same time, you get a valuable glimpse into which way key markets could move in the near future.
Getting back to the here and now, the good news is that stocks have quickly rebounded from the recent selloff.
But the bad news is that the rise in VIX may not be over just yet, which means stocks could remain vulnerable.
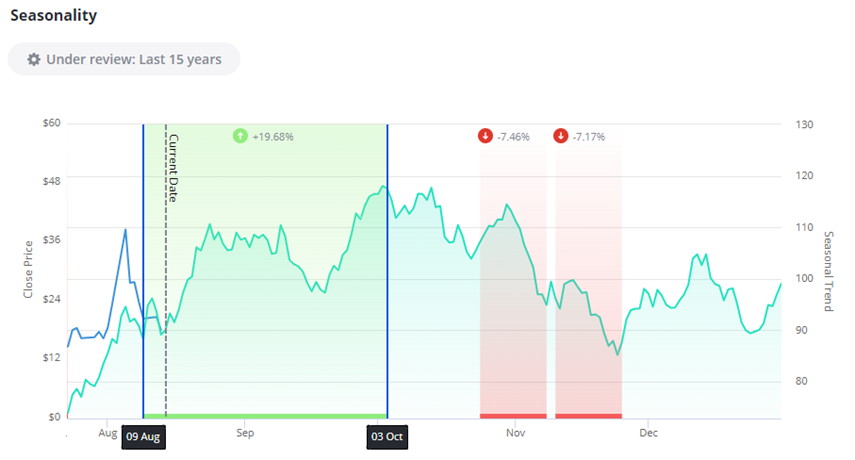
Let’s go to our exclusive Seasonality charts for a current update, starting with VIX:
This screenshot of VIX seasonality is current as of last night’s close: you can see the current date line marked with the vertical dotted line. In the box highlighted in green, you can also see that this seasonal uptrend in VIX – and the ongoing uptrend in market volatility – extends into early October.
The good news is that by November the VIX should reverse back into a downtrend, highlighted in red.
For a forecast even more important than VIX’s upcoming moves, let’s take an updated look at S&P 500 seasonality from here on out. And for this, I’ll defer to my colleague William McCanless.
William is our resident expert on seasonality, and the analyst of our Trade Cycles advisory. He’s been closely monitoring the S&P 500’s seasonality shifts for months now – and has identified a curious correlation between this year’s market moves and those of the 1990s you’ll want to hear about.
Here’s exactly what he had to say on the matter, published earlier this week:
Checking over the historical correlations again, the ’90s continue to be the single decade most correlated with 2024’s market action:
• 1990 – 80% correlated
• 1992 – 83% correlated
• 1993 – 90% correlated
• 1996 – 93% correlated
• 1997 – 93% correlated
• 1998 – 93% correlated
• 1999 – 92% correlated
With the exception of 1991, 1994, and 1995, all years are over 80% correlated, with five of them being over 90% correlated. Let’s take a look at the average of those years and see how they stack up with the current year’s price action…
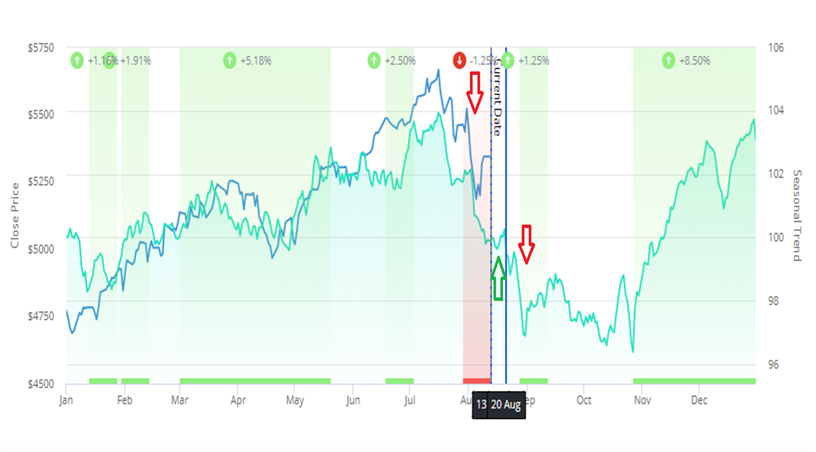
It really is moving almost in lock step, with 2024 prices (dark blue) trading very similarly to the average of the years I listed above (green):
Seasonality suggests the market should drop again into Aug. 31, after which there is a slight bounce into Sept. 17.
That’s followed by another bearish period into the end of October – just before the big end-of-year rally.
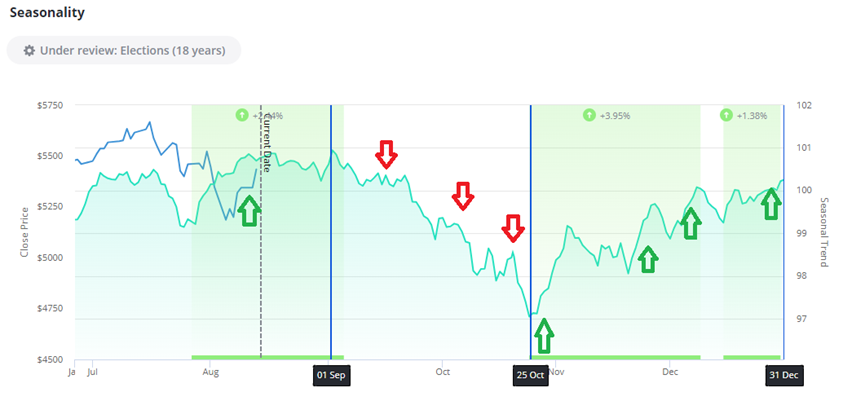
There you have it: Straight fromTradeSmith’s own expert on seasonality. The chart of the S&P 500 above is only a few days old, but I updated it myself, below, to give you a fresh look at our election-year seasonality data:
William correctly forecast the recent bounce that’s still underway now, with an assist from our data. But you can see that likely gives way to more downside ahead in September and October.
In fact, this nearly two-month period has produced an annualized average drawdown of 13.98%, occurring with an accuracy rate of 61.1% across all of the election years in our database.
But after stocks finally bottom out, we have a sizeable year-end rally to look forward to.
From the end of October through the end of the year, SPX delivers average annualized returns of 25.59% – with an even better accuracy rate of 77.8%!
Mike Burnick’s Bottom Line: TradeSmith’s seasonality studies can pair with our market-cycle analysis to make a powerful combination – one that gives you a glimpse into the future of the financial markets. And you can tap into these valuable insights everyday with our Trade Cycles advisory, managed by William McCanless.
It’s exactly what you need to help improve your trade timing, especially in these volatile markets. But you don’t have to take my word for it: you can see William’s latest Trade Cycles research for yourself right here.