TradeSmith Special Bulletin: A New Bear Signal Flashes on an S&P Index
Senior Analyst Mike Burnick here, writing in with an Inside TradeSmith Special Bulletin.
After yesterday’s brutal price action, the benchmark S&P 500 Index (SPX) is now close to entering a technical correction (a 10% drop from the highs) – a dubious distinction that the tech-heavy Nasdaq 100 Index (NDX) already achieved at the end of last week.
The economic uncertainty and high market volatility fueling these declines are expected to continue – making now a great time to review TradeSmith’s Market Outlook health indicators.
That’s especially true today… because yesterday at market close, a new “bearseye” signal triggered for the S&P 600 Index (SML):
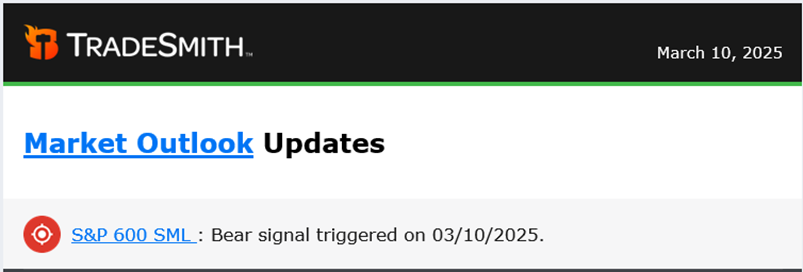
This is the first bearish signal we’ve seen trigger on an index since 2022 – when we saw all the major indexes trigger bullish signals. And though SML is the only market flashing a bear signal at this point, it’s an alert worth your attention.
Let’s break down what this signal means for the market – and for your portfolio.
A Rare and Powerful Market Signal
To trigger a bearseye signal for any index, at least 40% of stocks in that index must be stopped out, as determined by our TradeSmith trend and volatility indicators (the Stock State Indicators and the Volatility Quotient). Additionally, the index itself must also be stopped out.
When bearseye conditions apply, triggering a fresh signal, watch out: The forecast for that index calls for more downside ahead.
These signals are index specific – which is why it’s important to understand that SML is the ONLY market to flash a bear signal at this point.
So, what does this mean for investors?
Based on the historical accuracy and timeliness of our TradeSmith Market Outlook signals, the new bear signal suggests that you should consider avoiding any new stock purchases in the S&P 600 Index (SML), unless the stock is in the Health Indicator Green Zone.
Based on analysis of our historical data, we have found that Red Zone stocks exhibit below-average returns with higher risk. And with the S&P 600 flashing bearseye, these Red Zone positions could become a liability.
If you own small-cap stocks in your portfolio, be sure to review those positions immediately – and we suggest you manage these holdings according to our Health Indicator.
You can easily review your synced TradeSmith Finance portfolio to find the current Health Indicator ratings of your current stock positions. You can also find and review S&P 600 component stocks by clicking on the Markets option at the top of your Dashboard, selecting S&P 600 (SML) from the list of tracked indexes, and clicking on the Holdings tab on the Asset Details page – as shown below:
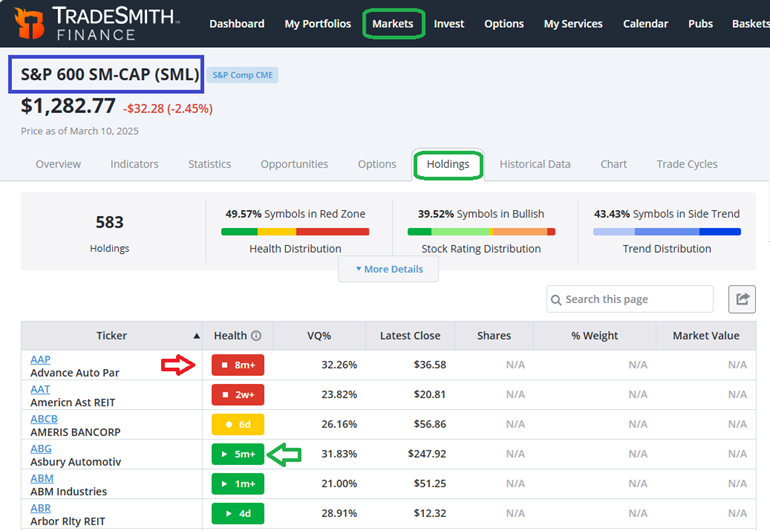
Consider avoiding any stocks that are now in the Health Indicator Red Zone… or any stocks that fall into the Red Zone and are subsequently stopped out in the days ahead.
What This Signal Means for The Markets
While the new bearseye signal could be an ominous sign for the S&P 600, and could point to hard times ahead for small-cap stocks, it’s important to remember that SML is the only index that has flashed a bear signal – and been stopped out in the Red Zone – at this time.
These signals appear on an index-by-index basis, and apply only for that specific index: So, SML’s bear signal doesn’t mean you should immediately pull out of your Nasdaq 100 holdings.
To keep a watchful eye on the Health Indicator ratings of each major index, check out the TradeSmith Finance Market Outlook page on a regular basis. You’ll find from your TradeSmith dashboard by clicking on Markets at the top of the page:
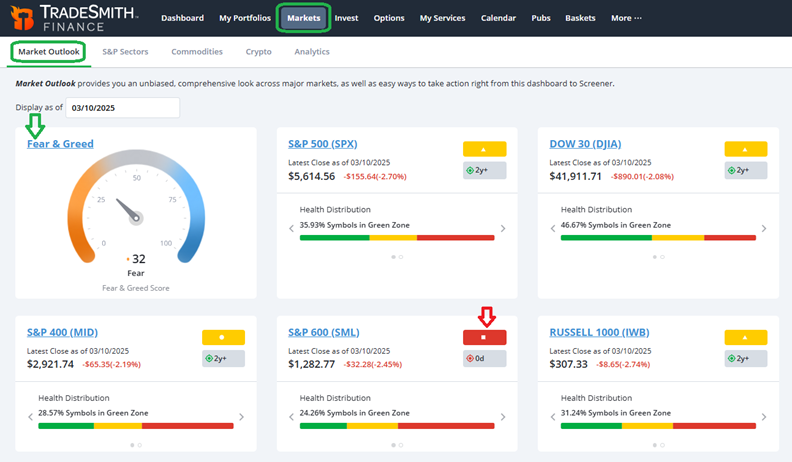
From this page, you can review the health of all the major indexes TradeSmith monitors. You can also click on the Fear & Greed Index (at the upper left of Market Outlook page) to get a more detailed view of current market trends and sentiments.
Looking at the page, though SML has fallen into the Red Zone, as shown above, the other major U.S. stock indexes are all currently in the Yellow Zone – with favorable health distributions.
All you’ll find right now are mixed signals. For example, several of the Fear & Greed components are still registering fairly high levels of greed:
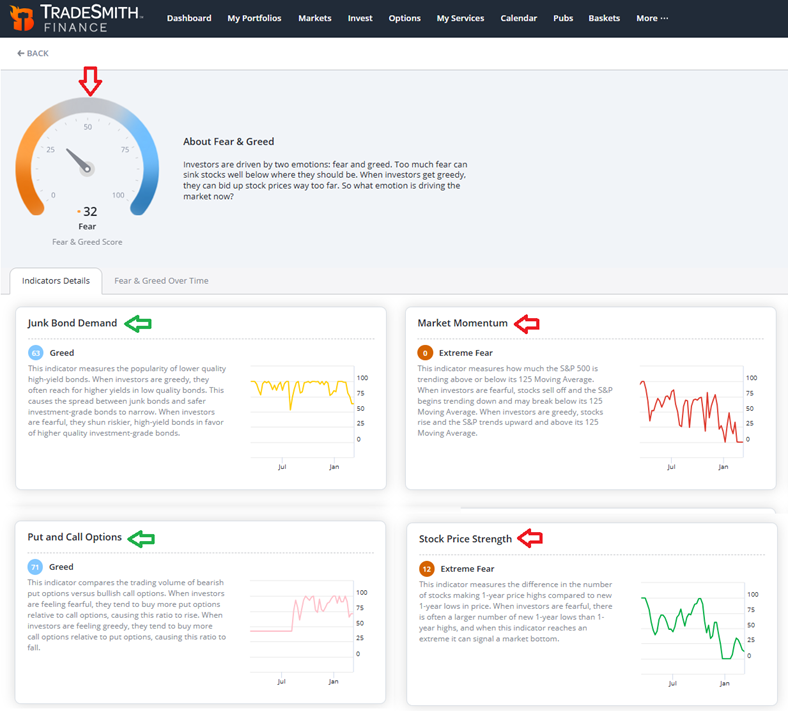
This includes Junk Bond Demand and demand for Put and Call Options, as shown on the left. Meanwhile, other components are registering Extreme Fear levels, including Market Momentum and Stock Price Strength, shown on the right.
Overall, the Fear & Greed Index reads 32 right now… which is in the Fear zone, but not yet at Extreme Fear.
Reviewing the Current Market Correction
Here’s my take: The current stock market correction seems largely driven by uncertainty – namely, uncertainty about trade tariffs and the negative impact they could have on the economy and forward earnings.
Markets hate uncertainty. And currently, there is little certainty available about the scope and duration of trade tariffs. In fact, tariffs have been implemented and then quickly rescinded in recent weeks, contributing to more uncertainty. Earlier today, President Trump announced plans to double tariffs on Canadian metal – leading to an immediate dip in the major indexes.
Corporate profits, however, are quite strong. Earnings results for the fourth quarter of 2024 showed S&P 500 earnings up 17% year-over-year. That marks the best growth rate since late 2020, when profits were still recovering from the COVID-19 Pandemic.
In my view, if stocks were selling off mainly due to concerns about recession and declining profits, I would expect the Junk Bond Demand indicator in the Fear & Greed Index to be declining sharply along with stocks. But, they’re not declining at this point.
Junk bond debt is typically issued by higher risk, over-leveraged companies. In a recession accompanied by falling profits, many of these same companies would be under extreme financial stress.
And junk bond prices would be falling along with stocks, perhaps even more sharply. But so far at least, junk bond demand appears healthy.
That’s why it seems to me this correction is more about uncertainty around trade policies, and high stock market valuations are adjusting down as a result.
You can see evidence of this most clearly in the stark difference in performance between the former market leaders, the “Magnificent 7,” and the rest of the stock market:
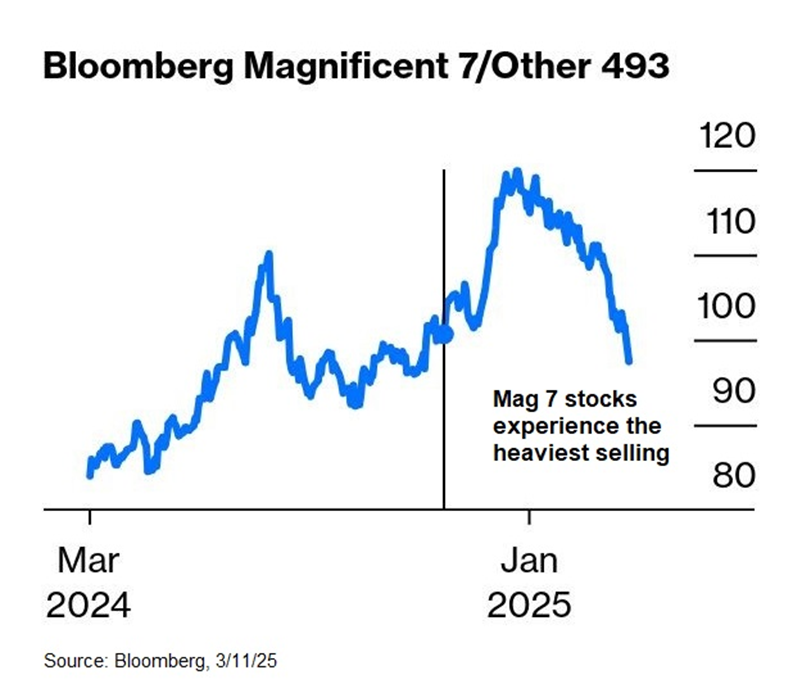
As you can see above, the Mag 7 mega-cap stocks as a group are down more than 20% from recent highs. Meanwhile, the S&P 500 Equal Weight Index is down just 7% so far.
This tells me the current market correction is more about stock valuations than overall panic. That is to say, the most expensive stocks are selling off the hardest because investors are no longer willing to pay high valuations amid this uncertainty.
And sure enough, the Mag 7 Price-to-Earnings (P/E) ratio has fallen sharply – from more than 40x down to (a still pricey!) P/E of 30x.
Meanwhile, the rest of the S&P 500 trades at a more reasonable P/E of 19.7x, when you exclude the Mag-7 stocks.
Mike Burnick’s Bottom Line: While SML’s new bear signal is not a sign to run for the hills, it is still very important to stay vigilant. This means frequently visiting our Market Outlook page and reviewing your own stock portfolio.
If additional bearseye signals flash for other indexes in the coming weeks or months, that would indicate more widespread market stress. However… that’s not the case right now.
Good investing,
Mike Burnick
Senior Analyst, TradeSmith