Let’s Take the Market’s “Pulse” with This Key Screener
As the S&P 500 Index (SPX) and Nasdaq (NDX) both inch closer to new all-time highs, three more domestic stock indexes flashed TradeSmith bull signals this week.
As I noted in Tuesday’s Inside TradeSmith column, the S&P 600 (SML), S&P 400 (MID), and Russell 1000 (IWB) all re-entered our Health Indicator Green Zone on Monday. Overseas, the S&P ASX 100 Australian Index (XTO) also entered the Green Zone that same day.
And since we’ve seen plenty of changes on our Market Outlook page recently, now is a good time to check in on the state of the stock market. (I’m currently in “list view;” you can change to “tile view” on the switch on the right-hand side.)
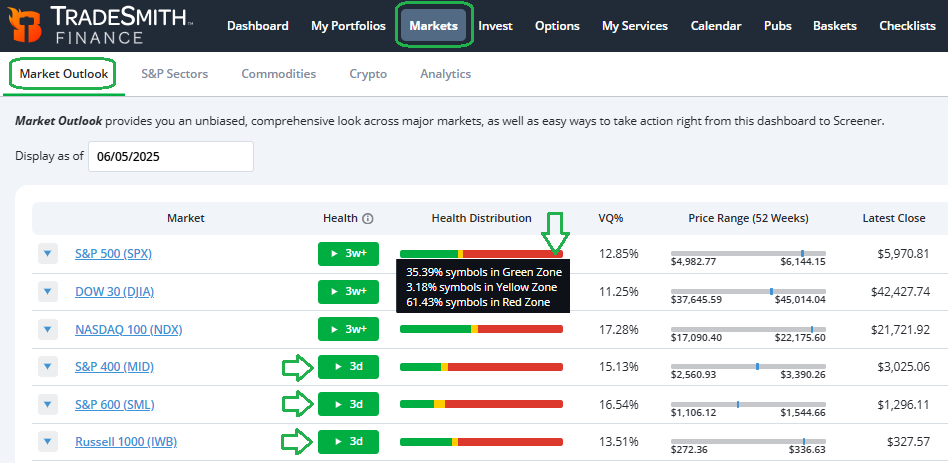
My trading day begins on this page, so I can keep a close eye on any Health and Trend changes for the broad stock market indexes, as well as changes for sectors, commodities, and cryptocurrencies as they come.
The three U.S. indexes that flashed green this week are highlighted above. And by hovering over the Health Distribution bar for any index, you’ll see more details as shown.
Now, despite its overall Green Zone reading – and being less than 3% away from it’s all-time high in February – the Health distribution for the S&P 500 shown above leaves a lot to be desired… with only 35.9% of the indexes stocks in the Green Zone, and the majority (61.43%) still in the Red Zone.
By contrast, at the last market high in February, 55.7% of S&P 500 stocks were in the Green Zone and only 32.7% were in the Red Zone. This is a bit of a negative divergence in terms of stock market breadth.
The phrase “the more the merrier” comes to mind – and applies very well to stock market rallies. The more stocks that are participating, i.e., making new highs and in healthy uptrends, the better. And naturally so.
But right now, there is less participation among individual stocks than we saw in February, when the S&P 500 Index was trading at a similar price level. That’s a bit of a red flag for me.
So, let’s dig deeper. Simply click on the highlighted link for any index to get even more details on the Health, Trend, and Ratings distribution of each market:
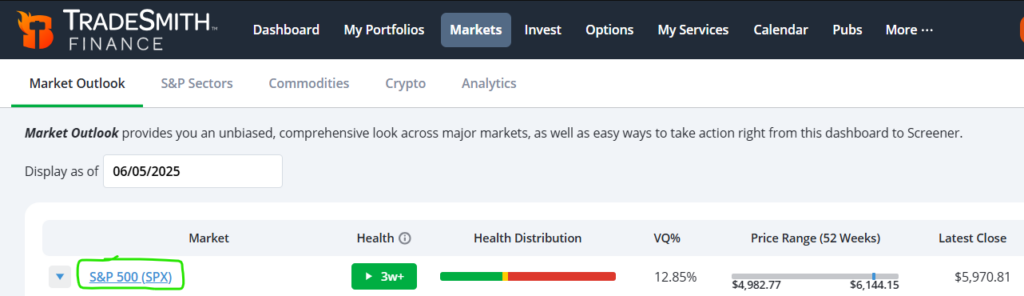
Here’s where the S&P 500 stands now.
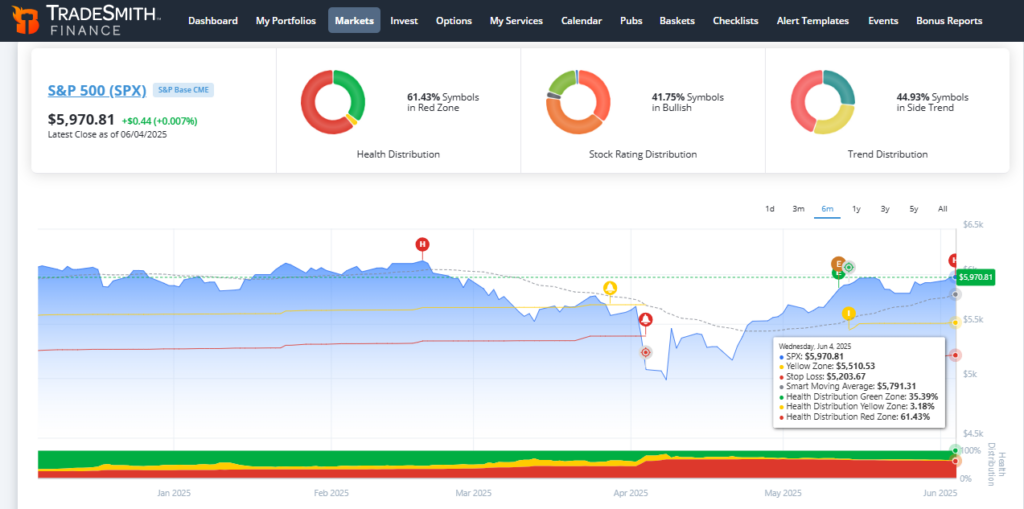
The S&P 500 index itself is well above its Smart Moving Average, which is currently $5,791.31 and rising. That’s a very bullish sign for the market. Any dips we do get in this uptrend should hold that key moving average in order to maintain the uptrend.
As for the trend distribution for individual S&P 500 stocks, it’s again a case of poor breadth: The majority of stocks in this index (44.93%) are in side-trends, while 28.4% are in downtrends and just 26.6% of S&P stocks are in uptrends.
But the large number of stocks that are in side-trends isn’t necessarily a bad thing. It simply shows a market in transition, and it can provide bullish fuel to this rally as more stocks move back into solid uptrends.
I’d like to see the percentage of stocks in uptrends rise well above the share of down-trending stocks, to feel more confident in this strength. Something to keep an eye on.
Now, you can quickly and easily perform the same stock market breadth analysis on all of the major indexes every few days, or at least once a week, as I do.
Let’s check in on to the individual sectors of the S&P 500…
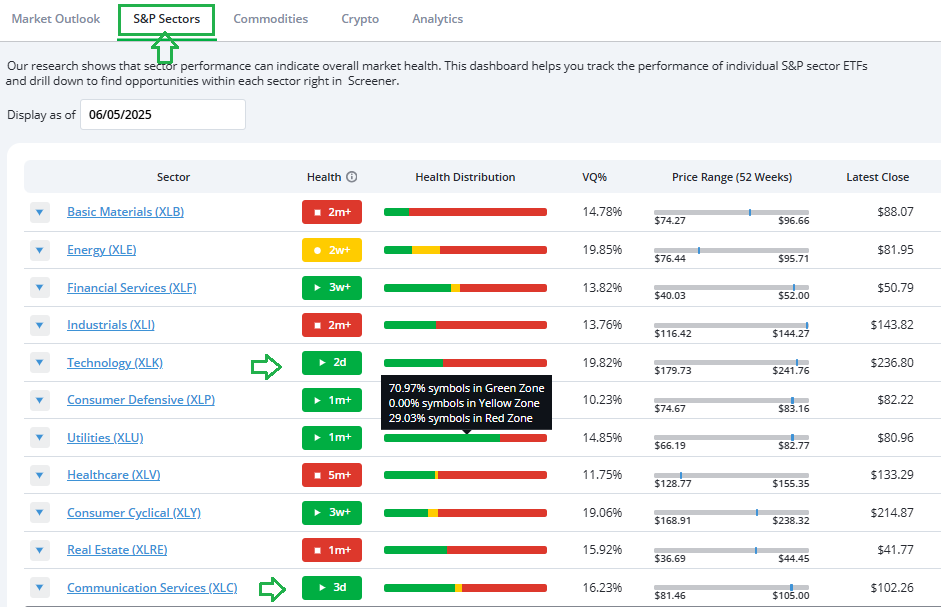
Once again, you can hover over the Health Distribution column for any of the sectors to get more detail.
At a glance, here’s what we find:
- The healthiest sector currently in the S&P 500 is Utilities, with 70.97% of sector stocks in the Green Zone.
- Both the Technology and Communications Services sectors re-entered the Health Indicator Green Zone just this week.
- As far as sector breadth goes, again, we’re looking at a generally poor health and trend distribution across the sectors.
- Aside from the defensive Utilities sector, the other 10 S&P 500 sectors show the majority of their stocks in the Red Zone. The worst is Basic Materials, with over 80% of its symbols in the Red. And both the Consumer Cyclical and Healthcare sectors have more than two-thirds of their component stocks in the Red Zone.
- Also, I was surprised to see that 63.8% of Technology stocks are still Red, despite the sector itself flipping to Green this week.
Again, you can click on the highlighted link to each sector for more details on each sectors Health, Trend, and Ratings distribution.
I keep a close eye on the sector Health and Trend distributions every single week, and I suggest you do the same. It’s a great way to spot new buying opportunities in sectors – and stocks within them – that are transitioning to a healthier state with increased uptrends.
Right now, only the Utilities and Communication Services sectors have more stocks in uptrends than downtrends.
Another section of the Markets page where I like to prospect for new ideas is the Analytics page. Specifically, the list of stocks making new highs (which, if you scroll down, you will see following a big infographic of the Markets and the S&P 500 Components Daily Change)…
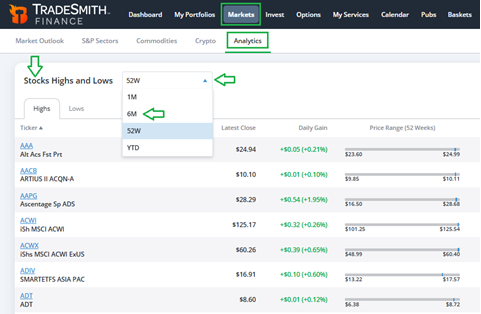
Momentum can be a powerfully bullish force in the stock market. I like to see which stocks are leading the market trend. You can use the dropdown to alter the time frame and toggle to new Lows and Highs.
The S&P 500 is still down slightly over the past six months. So, I use the dropdown box to pull up a list of stocks at new six-month highs to find the stocks leading the way to the upside.
Mike Burnick’s Bottom Line: Make our TradeSmith Markets page a frequent stop on your regular tours of the markets. It’s a great way to take the pulse of the current trading environment, all by keeping a watchful eye on changes to the Health, Trend, and Ratings distribution for each index and sector.
And while you’re in that part of TradeSmith Finance, I recommend frequenting the Analytics page as well, for a deeper dive into stock market internals. Plus, you can perform similar analysis on the broad range of commodities and cryptocurrencies we track as well.
Good investing,
Mike Burnick
Senior Analyst, TradeSmith
P.S. I’m sure I speak for everyone when I say it’s a breath of fresh air to see more Green than Red on the Market Health overview. And while an overall index’s or sector’s TradeSmith Health reading is not indicative of the Health of each and every stock under its wing, seeing these indexes and sectors flip into the Green Zone gives us the thing we need most as investors and traders: a level of certainty in the markets.
Of course, Black Swan events exist, and nothing is promised – as we well know – but eliminating as many unknowns as possible makes for the potential of better, more profitable trading.
That’s why when my colleague Jeff Clark told us his research is showing another dramatic shift in the markets on the way… I – and the rest of Team TradeSmith – all listened closely.
Jeff’s not one to make calls like this lightly; he foresaw the 2008 financial crisis, the COVID crash, the 2022 bear market, and the tariff scare in 2025…
And he didn’t just see these events coming, he took action: His readers had the chance to grab returns like 227% in eight days from Yum… 90% in four days from Marvell Technology… even 89% in two days from Dell, all from his recommendations during these volatile times.
If what Jeff sees down the pike comes to fruition, we could be looking at another flip of the Health switch in the markets… and that means you’ll want to be as prepared as possible now – before it’s too late.
On Wednesday, June 11 at 10am ET, Jeff will be going live with his Countdown to Chaos Event. You can automatically reserve your spot now by clicking here.