Here’s How to Follow the Big Money During the Next Dip!
The non-stop market rally continues to impress, as the S&P 500 Index notched another new all-time high last week – with the index crossing above 6,300 for the first time ever on Thursday.
In fact, the blue-chip stock index has traded above its short-term 20-day moving average for 60 straight days now.
And despite prices briefly retreating below that average this morning, the S&P recovered to close day 61 higher, keeping that win streak going.
You’d have to go back over 25 years, all the way back to the late 1990s, to find a longer winning streak for stocks closing above this key trend line!
Now, it’s true – that last epic win streak ended badly, during the dot.com bust in 2000.
But this one doesn’t have to end that way… though it all depends on how the big money flows from those major investors who are willing to buy the dip.
After briefly turning negative in April during the tariff turmoil, mutual fund and ETF money flows have been climbing steadily, as you can see below:

My friend and colleague on Team TradeSmith, Jason Bodner, keeps close tabs on big money flows as they move into (and out of) stocks and sectors across the market.
Recently, Jason noted that his proprietary Big Money Index (BMI) jumped above 80 in early June and has been above that overbought level ever since.
On a related note, year-to-date stock fund inflows rose by $22.7 billion through the end of June.
But there’s no reason why stocks can’t keep on moving higher – even when the BMI is overbought. The thing to watch out for is when Jason’s BMI declines out of overbought territory.
Because when that happens, stocks often struggle in the days to follow. The circles in the chart below show eight points in recent years where the BMI rose to overbought levels, then dropped back below the 80% threshold:
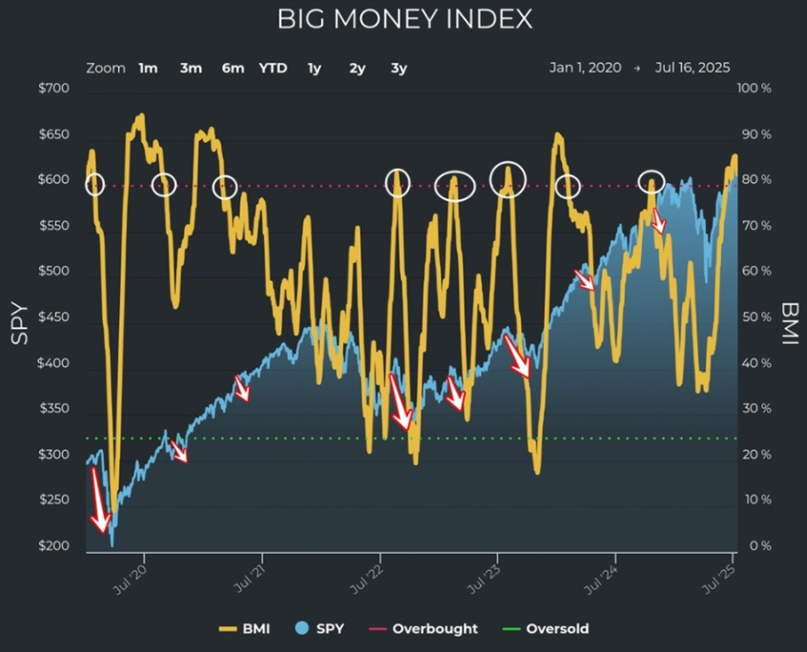
As you can see, they often line up with pullbacks for the S&P 500.
With the BMI currently in overbought territory, I’d expect a retreat from all-time highs sometime soon… and the timing lines up with regular market seasonality: The next two months are some of the weakest of the year for stock market performance, seasonally speaking. And that could very well be the trigger for the next pullback in stocks from overbought levels as we enter August.
But given the strong trend of investors eagerly buying-the-dip that we’ve seen lately, a market pullback could be an excellent opportunity to pounce on a pause in the rally – think of it as doing some early holiday shopping, as the market approaches its strongest six months of the year in the Fall.
The only question, then, is what to buy?
And to help answer that, here’s another insight from Jason’s money flow analysis:

This pie chart shows the distribution of big money inflows by sector since early May (when “Liberation Day” tariffs were first put on hold).
It’s no surprise that tech is leading the pack, with 19.9% of big money buying flowing into this sector.
But what surprised me a bit is the amount of big money flows earmarked for financial stocks: The sector is second only to tech when it comes to attracting major investor attention, taking 17.7% of the inflows since May.
Behind financials, industrial and consumer discretionary stocks round out the top four destinations for big money buying in recent months.
And I suspect that, in the event of a possible market pullback, big money buyers will most likely pick up right where they left off, targeting these same favorite stocks and sectors once local lows are found.
With that in mind, now is a great time to set up an evergreen screener based on Jason’s proven Quantum Score. This metric helps quantify a stock’s fundamental and technical strength, pairing them together with the all-important presence of big money flows.
And we can use Jason’s Quantum Score to figure out exactly where that big money could end up.
Scanning for Big Money Beneficiaries with the Quantum Score
To get started, log into your TradeSmith Finance dashboard.
Once you’re on the platform, simply click on Invest on the main menu bar at the top of the page, then click on the Screener tab on the following page.
Now, here’s a simple screener that leverages Jason’s big money flow analysis:
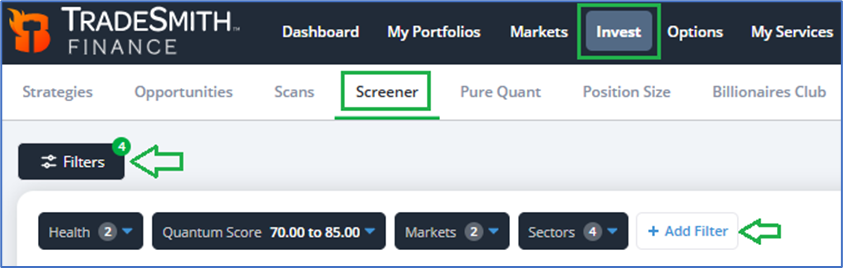
As shown above, you’ll need just four filters for this screener.
To set this screener up yourself, start by clicking on the + Add Filter button at upper right.
Next, add these filters by checking the appropriate boxes in the filters menu (you can uncheck the default selections as needed to remove them from your filter list):
- Health: Set to Green or Yellow Zone…
- Jason Bodner’s Quantum Score: Set to “Between 70 and 85”…
- Markets: Choose the S&P 500 (SPX) & Nasdaq 100 (NDX)…
- And finally Sectors: Select Consumer cyclical, Financial services, Industrial, and Technology.
To access the filter for Jason Bodner’s Quantum Scores in the Screener tool, you must subscribe to his Quantum Edge Pro service – or be a TradeSmith Platinum member. So, if this filter doesn’t show on your menu, but you would like access, simply call our Customer Care team at 888-623-0858 to find out more.
With all these filters in place, we are looking for large cap stocks in the Health Indicator Green or Yellow Zones, that also have a Quantum Score between 70 and 85.
According to Jason’s research, this score range is the sweet spot for new buys, as it holds stocks with strong fundamental and technical metrics as well as the big money inflows we saw earlier.
Finally, we’ve set our screener to zero in on the four sectors (Consumer cyclical, Financial services, Industrial, and Technology) that have been favorite targets for big money buys recently.
Don’t forget, however, that you can always add additional filters to this screen as you wish. You have a wide array to choose from, including filters for technical performance, fundamentals, and valuation, more of TradeSmith’s proprietary metrics – and more.
Be sure to mix and match filters to make it your own, and see what new ideas you can come up with. If you’re satisfied with your final screener, be sure to hit the Save button next to the green Run Screener button to save it for later.
When I ran this screen myself, I got 101 results. That’s a good starting point for more research on my part. Due to limited space, here are the top 10 stocks that made the cut – sorted by Health:
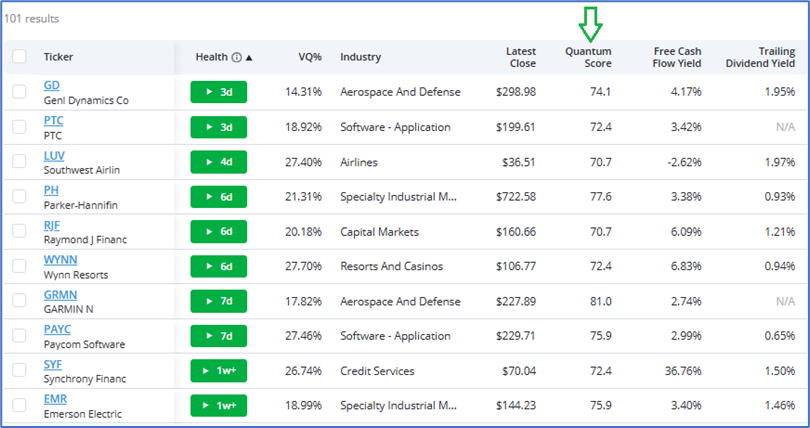
There are plenty of stocks represented from each of the four favored big money sectors: from General Dynamics (GD) and Parker Hannifin (PH) for industrials, to Raymond James (RJF) and Synchrony (SYF) in the financial sector.
And speaking of the financial sector, I’m especially keen on financial stocks right now. They’ve performed consistently well this year, up nearly 9% and beating the S&P 500 so far.
But financials are also much cheaper than the overall market – with a price to earnings (P/E) ratio of just 17.6X, compared to 26X for the S&P 500. That’s a relative bargain.
And it makes financial stocks a top buy-the-dip candidate in my book.
Mike Burnick’s Bottom Line: Keep in mind that August and September are the two poorest performing months of the year for markets, with the Dow Jones Industrial Average sinking an average of -0.83% and -0.96% for the month since 1990, respectively. So, you may not want to rush out and buy stocks found with this screener search tomorrow.
Instead, make it your own by customizing the screener filters – shaping it to suit your personal strategies with Jason Bodner’s proven Quantum Scores as the foundation. Then, revisit the saved screener from time to time, especially after a market pullback, to uncover stocks with strong big money inflows.
Good investing,
Mike Burnick
Senior Analyst, TradeSmith
P.S. Jason’s Big Money Index is sitting at overbought levels as the S&P 500 digests its latest all-time high. That’s reason enough to prepare for a pullback, but there’s another warning sign flashing red as we enter August – and ignoring it could mean disaster in the coming weeks.
TradeSmith’s groundbreaking Seasonality algorithms have analyzed decades of trading history for hundreds of stocks, indexes, and commodities across the market… and all signs point to a major shift in market trend starting as soon as July 30.
Our Seasonality software can identify the hidden cycles that drive prices year after year, scanning the market for the best (and worst) periods to trade a stock – and the Seasonal Edge trading system, our crown jewel at the center of it all, tells you exactly when to enter a trade for the best potential results… right down to the day.
That system has given us a single message: Watch out!
The warnings have caught the attention of everyone on Team TradeSmith, but no one has been more concerned than our CEO, Keith Kaplan. He’s determined to get the word out ahead of the curve – and he went online earlier today with a special presentation on the turning point.
I’ve covered Seasonal Edge and our seasonality tools plenty of times in Inside TradeSmith, but if you haven’t gotten your hands on this powerful system already, now’s the time. And as an added bonus, Keith is giving you the opportunity to try out these tools for yourself, to see just how powerful they really are.
If you missed Keith’s presentation this afternoon, don’t panic: You can click here to watch a replay of Keith’s presentation now. You won’t want to miss it.