The Smarter Way to Trade: Discover Hidden Opportunities with TradeSmith’s Fair Value Tool
Financial markets are generally efficient – but there are times when investors can still beat Wall Street at its own game.
After nearly 40 years in this business, I can tell you: Market pricing is generally efficient most of the time … but not all of the time.
And that’s especially true in certain corners of the market that are more volatile.
Even in very liquid markets like the New York Stock Exchange (NYSE), there are inefficiencies in the way certain stocks are priced.
Just think about the long-term performance advantage of “value” stocks over “growth” stocks. That inefficiency exists because investors are emotional.
It’s easy to fall in love with a great story behind a hot growth stock. And it’s just as easy to ignore a blue-chip stock that’s fallen from grace and is going down in price.
But it’s because of this emotional dynamic that investors frequently overpay for growth stocks – even outstanding ones – while fallen blue chips often get overlooked by investors. That is, until they’re so cheap they finally turn around.
But for my money, one of the best places to consistently spot price inefficiencies – that you can potentially profit from – is the options market.
A Smarter Way to Spot Opportunity: The Fair Value Options Tool
Option prices for stocks and ETFs are based on probability and implied volatility –essentially, best guesses about how unpredictable the underlying security price will be.
But today, high-frequency trading makes prices especially volatile. It can be difficult for the models to keep up with ever-changing reality.
That’s when you can find and profit from pricing inefficiencies – and now, our software developers just launched a great new tool to help you do just that.
Our exclusive, TradeSmith Fair Value Options Chart compares the latest market price of any option to its data-driven fair value – calculated internally using our own methodology.
This shows you, at a glance, whether an option is statistically (and relatively) cheap or expensive.
While it can’t predict the future, the Fair Value graph can help you uncover hidden opportunities to profit when market prices diverge from what the historical data, volatility, and probability suggest is the “correct” price.
For options traders, that means you can quickly recognize opportunities to buy low (undervalued options) and sell high (overvalued options).
Please Note: The Fair Value Options tool is available only certain subscriptions. To learn how you can get access to the Fair Value tool, keep reading – or go here to learn how this tool could help you see triple-digit gains in mere hours.
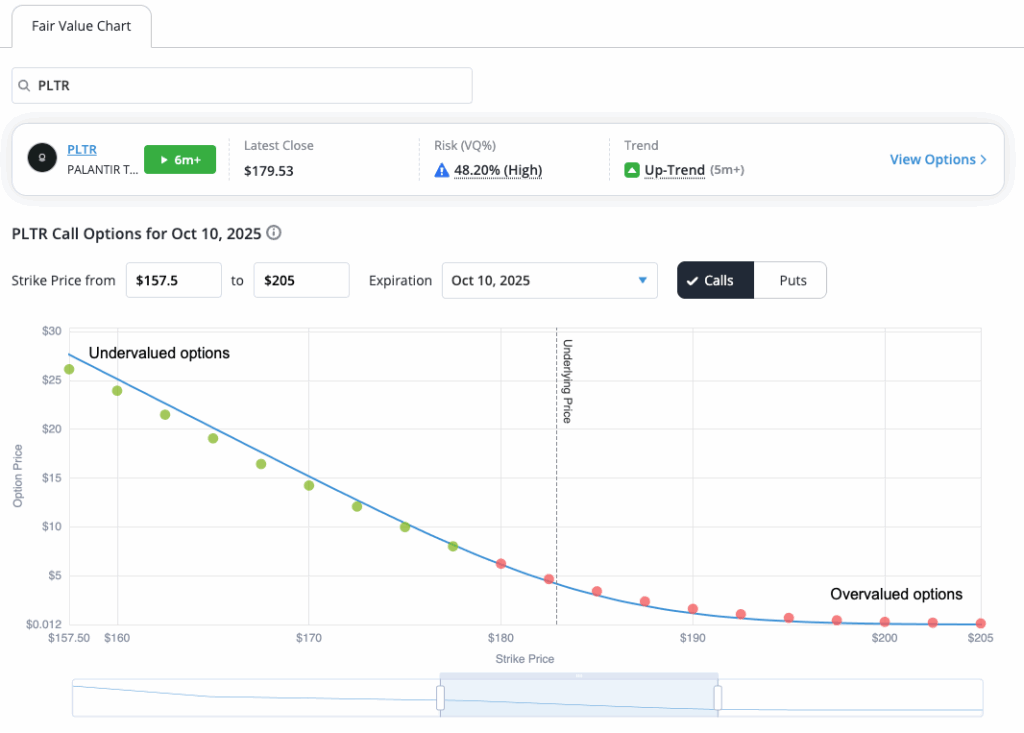
To locate and start taking advantage of this valuable tool, simply log into your TradeSmith Finance account, click on the Dashboard page from the main menu, and scroll down. You’ll find the Fair Value widget just above the Platinum Model Portfolios.
In the example above, I’m looking at Palantir Technologies (PLTR) call options expiring on Oct. 10, 2025. PLTR shares recently closed at $179.53, and the stock remains in a strong uptrend with a 48.2% VQ%, signaling high risk but strong momentum.
The blue line represents the theoretical fair value options curve, calculated by TradeSmith using a modified Black-Scholes model.
The placement of the dots indicates the actual market price of the option (y-axis) in relation to its strike price (x-axis).
You’ll notice that some dots are green, and some dots are red. The green dots, which appear above the blue line, indicate that the option is undervalued – and therefore a good buy.
The red dots, which appear below the blue line, indicate that the option is overvalued – and therefore not worth buying.
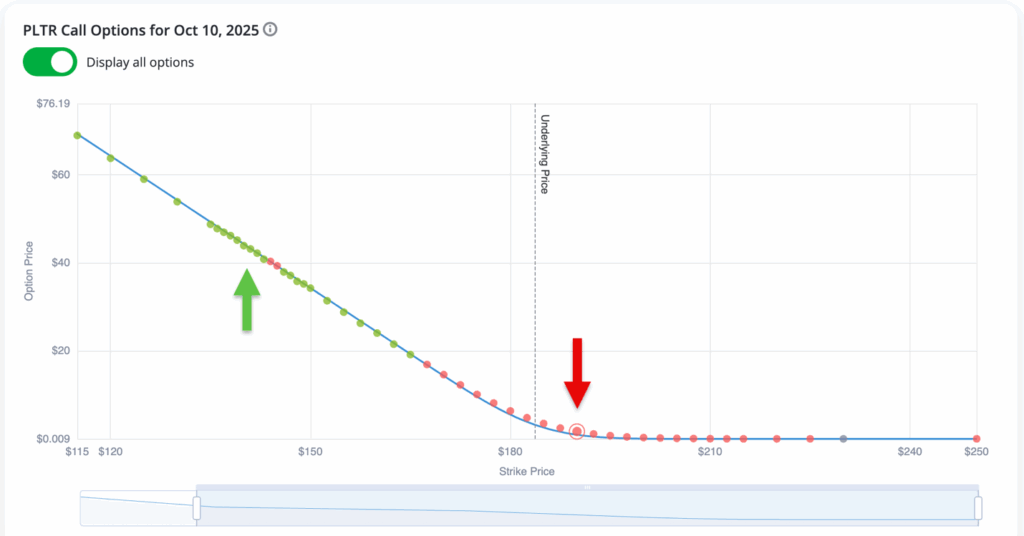
Simply hover over any dot with your mouse to view details about how underpriced the option is, according to our analysis.
You can even click the dot to get more details.

For example, the PLTR Oct. 10, 2025 $190 call option last traded at $1.99 (at the time of this writing). But according to our calculations, its fair value should be $1.17, meaning it’s currently 70.1% overvalued.
With a Probability of Profit (POP) of 2%, a target ROI of 5.9%, and a maximum profit of $198, the market may be overpaying for these long call options – making it potentially attractive for option sellers.
Option Trading Tips
- A buyer of call and put options should look for undervalued options relative to fair value…
- And if you’re a seller of call and put options, perhaps as a way to earn income, look for options that are overvalued compared to fair value.
Here’s an example below – this time using the same analysis but for PLTR put options.
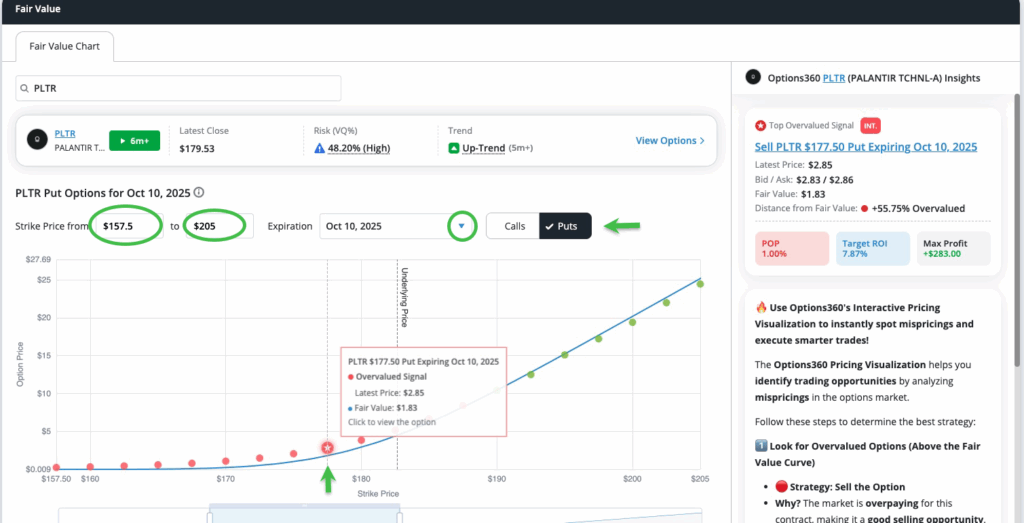
For instance, let’s say you’re bearish on PLTR and expect the stock to drop. You might consider scanning for put options to buy.
The PLTR Oct. 10, 2025 $177.50 put option recently traded at $2.85 – but its fair value was only $1.83, according to our calculations.
So, in this case, you may be overpaying to buy this put option. But you can also look at it another way…
If you’re looking to sell this out-of-the-money put option to earn income – and perhaps aim to buy PLTR shares cheaper – you’ll be getting paid more than fair value for selling it.
And you can earn a bit extra as the option price converges with its fair value.
This is critically important info for frequent option traders – knowing whether an option is over- or undervalued before placing a trade can be the difference between success and failure. Then, when you keep stacking successes, of course, you can make some real money in the markets.
Mike Burnick’s Bottom Line: It’s critically important to know whether any option is overvalued or undervalued before you place a trade. Our new Fair Value Option graph gives you a quick view of the market price compared to the data-driven fair value. Don’t leave home – or trade options – without it!
Good investing,
Mike Burnick
Senior Analyst, TradeSmith
You already know the Fair Value Options tool – it’s one of the smartest ways to spot mispriced opportunities in the market. But what you may not realize is just how powerful it really is.
And last Tuesday, TradeSmith CEO Keith Kaplan pulled back the curtain and showed what this technology can actually do – (sometimes called the “T-Line”) pinpointing trades capable of delivering 113% gains in one hour… 172% in four hours… even 600% in just one hour.
It’s no exaggeration to say this could be the start of a new era in trading – much like the birth of options trading in 1973 or the first ETF in 1990. If you missed the big reveal, don’t wait. Watch the T-Day Summit replay now and see the fair value tool in action.