Get Ready For 2026: Reduce Risk With An End-of-Year Portfolio Rebalance!
It’s that time of year again!
After today, there will only be fourteen and a half trading days left in 2025.
As far as this year is concerned, it’s been another good year for the stock market… depending on what you owned, anyway.
Despite a recent slowdown, the “Magnificent 7” mega-cap tech stocks continued to outperform this year, with the seven up 22% so far as of the end of November.
On the other hand, the S&P 493 – that is, the rest of the S&P 500 minus the Mag-7 – was up only 14%.
Meanwhile, the S&P 500 Equal-Weight Index (RSP), which is more representative of the “average” large-cap stock’s performance, has gained just 8.4% as of the end of last month.
Now, the idea of the top stocks in the index dominating the annual returns chart is nothing new. But the S&P 500 has never been as highly concentrated in technology-enabled stocks as it is today.
Just 20 years ago, Microsoft and IBM were the only tech companies among the S&P’s top 10.
Ten years ago, there were also just two – Microsoft and Apple.
But today, the list is dominated by tech-enabled stocks. In fact, as you can see below, only two stocks in the S&P’s top 10 are not technology related: JPMorgan (JPM) and Berkshire Hathaway (BRK.A)…
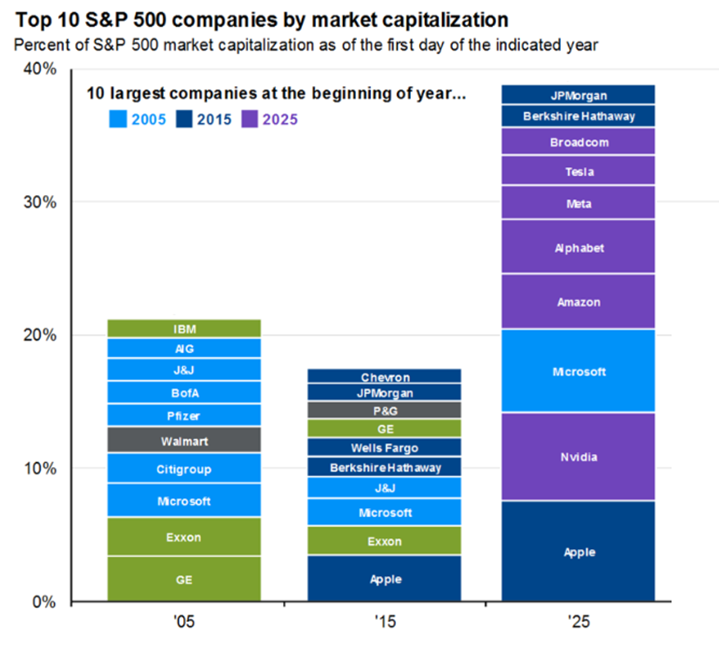
Since 2022, the Mag-7 tech stocks accounted for 55% of the price return for the S&P 500 Index as a whole. And 45% of 2025’s year-to-date gains came from just these seven stocks.
This year, the dominance of the Mag-7 has diminished somewhat… and I believe this trend is likely to continue in 2026.
So, I’m on the lookout for a broadening in the stock market rally as we enter the new year.
If that’s the case, now is the time to rebalance your portfolio to make room for more than the Mag-7, especially if you now find your portfolio overweighted towards any of these stocks.
There is a simple way to do this: By using the TradeSmithRisk Rebalancer tool to review your portfolio before the new year.
And today, I’ll take you on a guided tour of how to use this valuable tool.
A Holiday Season Health Check With TradeSmith’s Risk Rebalancer
TradeSmith’s suite of tools and algorithms crunch all the cold, hard data on every stock in our database. Sales, profits, a stock’s health, trend, volatility, and more – all to give you our rational, unemotional guidance on what to do with every stock in your portfolio: buy, sell, or hold.
And then we go one big step further by suggesting how much of each stock you should hold in your portfolio, so you’re not risking too much of your hard-earned money on any one of them.
Here at TradeSmith, we believe in equal-risk parity when it comes to managing a stock portfolio. This simply means taking the same amount of risk in each stock position. What it does not mean is taking the same position size in each stock.
Each stock has its own unique “personality” – and different volatility.
Our Risk Rebalancer tool takes a portfolio of stocks and equally balances your investments according to our proprietary risk measure, the Volatility Quotient (VQ).
VQ is our powerful risk-management tool that can help you allocate more money to lower-risk stocks and less money to your riskier positions.
Essentially, you can think of the Risk Rebalancer tool as a fancy calculator that helps ensure you are risking the same percentage of your portfolio value on each trade, based on each stock’s unique VQ personality.
It analyzes your current stock portfolio and gives you an optimal position size for each stock, right down to the exact number of shares of each stock you would need to add or subtract to stay in balance.
That’s what’s called equal-risk position sizing, and it’s a proven way to manage your investments.
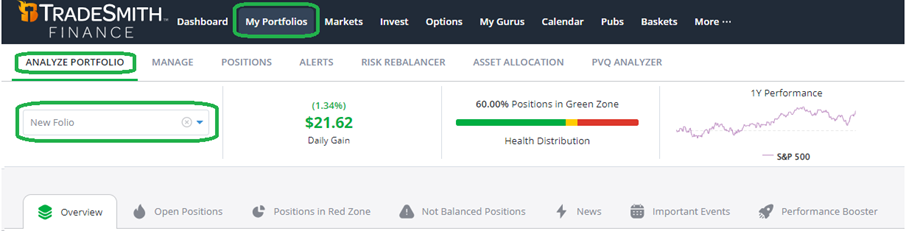
To see if your portfolio is properly in balance in terms of risk, simply click on the My Portfolios tab from the main menu of your TradeSmith Finance dashboard.
If you haven’t added a portfolio to your TradeSmith Finance account, you can do so via the Manage tab – where you can list your positions manually, import a .CSV file from your computer, or even sync our systems with your brokerage account to pull the position data automatically.
Once your investment portfolio is set up, just go to the Portfolios tab, and select the Analyze Portfolio option to access our Risk Rebalancer.
Run your portfolio through the analyzer by selecting it from the drop-down menu, as shown in the screenshot below:
(Note: Risk Rebalancer is available to TradeStops Premium, Pro, and Lifetime members, as well as Trade360, TradeSmith Essentials, and TradeSmith Platinum members. And as a reminder, mine is a Platinum account, so you may see features here that are not available to you.)
This takes you to the Overview tab – and here’s what it should look like on your screen:
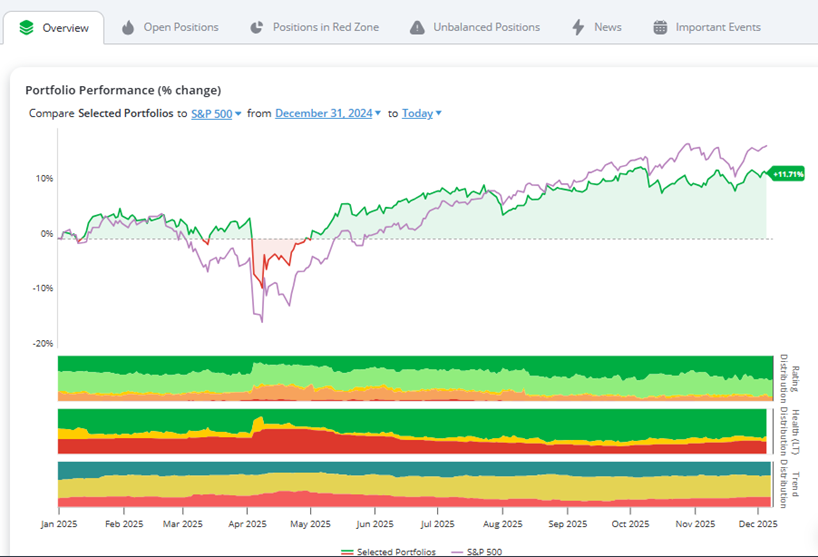
The Overview tab shows you at a glance how well your portfolio has performed, and allows you to compare it to an index like the S&P 500 or Nasdaq.
Scroll down and you can see your current portfolio allocation broken down by Health Grade, Stock Rating, and both Sector and Industry allocations.
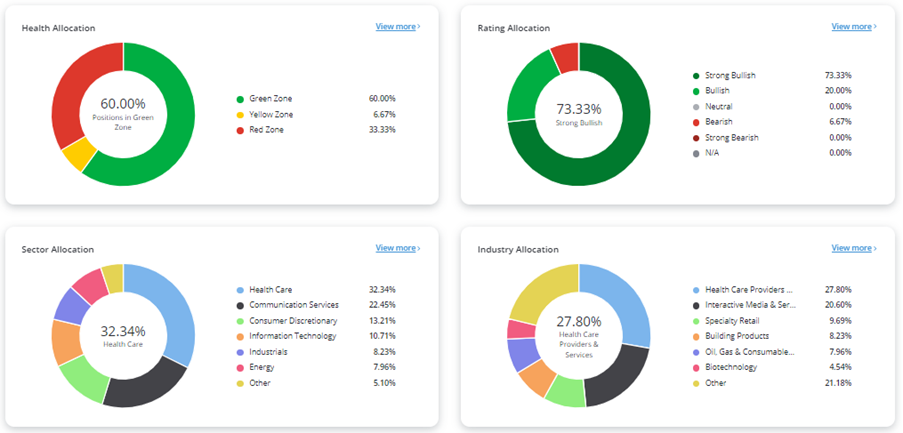
The Overview tab also shows how well your portfolio has performed, and allows you to compare it to an index like the S&P 500 or Nasdaq.
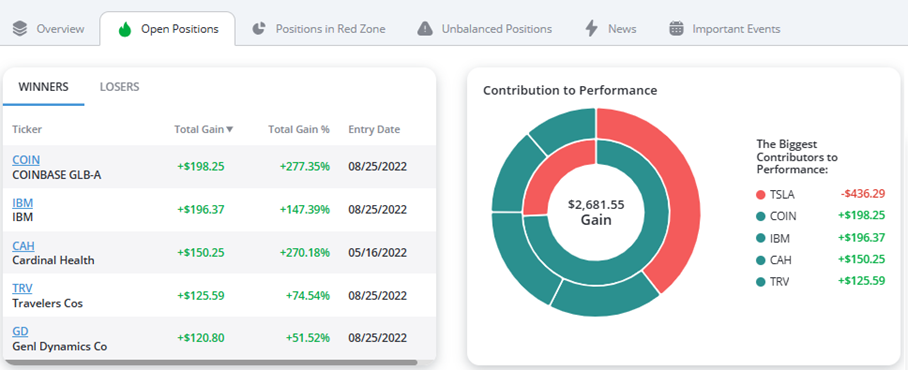
Next, the Open Positions tab displays a list of your stocks with key metrics listed, including winners and losers – and the stocks that contributed the most to your overall performance:
Now, click on the fourth tab over, labeled Unbalanced Positions, shown below:
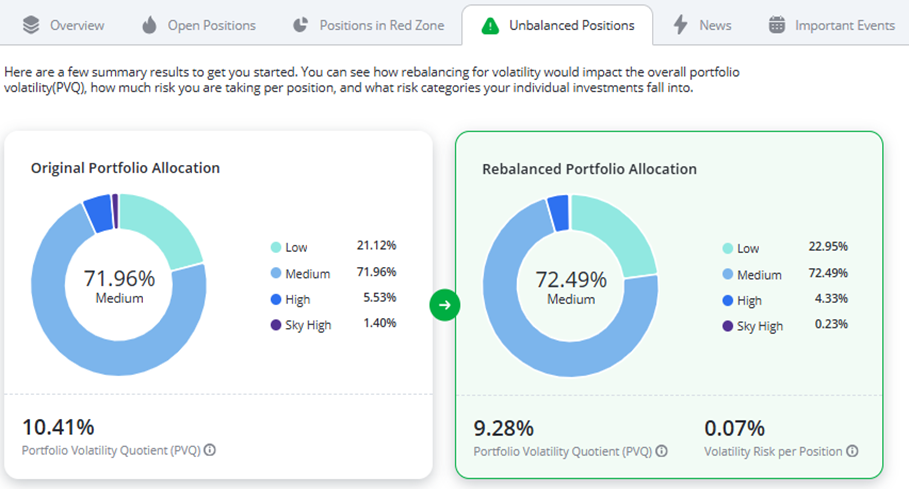
This screen shows whether your portfolio is properly balanced according to risk parity, and it gives you a before and after view of how your original portfolio (left) compares to our suggested rebalanced risk-parity portfolio (right).
In this case, my original portfolio (left) has a portfolio VQ (PVQ) of 10.41%, which isn’t far off the mark from the ideal rebalanced portfolio with a PVQ of 9.28%.
What can I say? I’m a good stock picker.
Our system also displays your positions that are considered most overweight in terms of risk, as well as those considered most underweight. Simply click on the arrows to scroll through all positions.
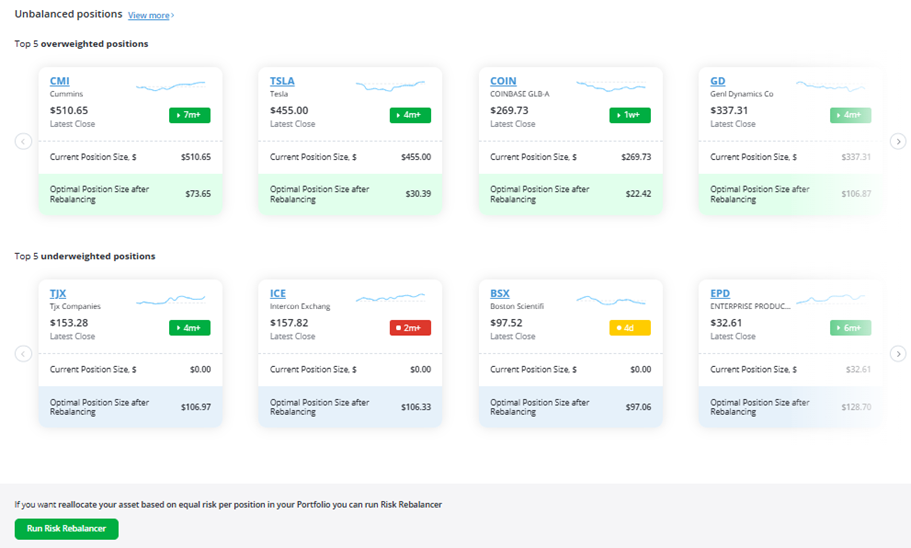
Above, you can see that I have a higher, overweight allocation to some riskier stocks, like Tesla (TSLA) and Coinbase (COIN). And I have underweight positions in lower risk stocks like Boston Scientific (BSX) and Enterprise Products (EPD).
Now, to run the Risk Rebalancer,simply click on the green button at the bottom left. That takes you to the screen below:
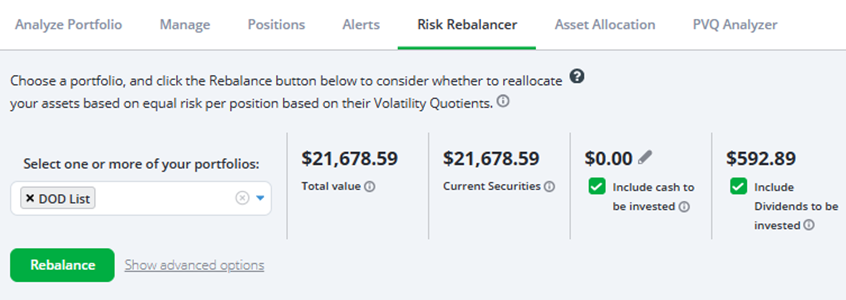
To see our suggestions on how to get your portfolio back into balance, just click the green Rebalance button at lower left. You can choose to include extra cash along with any accumulated dividends to be invested in your newly rebalanced portfolio with the options to the right.
This takes you to the Rebalance Overview page shown below. If the button is grayed out, be sure to select your portfolio from the dropdown above.
Here’s what Risk Rebalancer tells me:
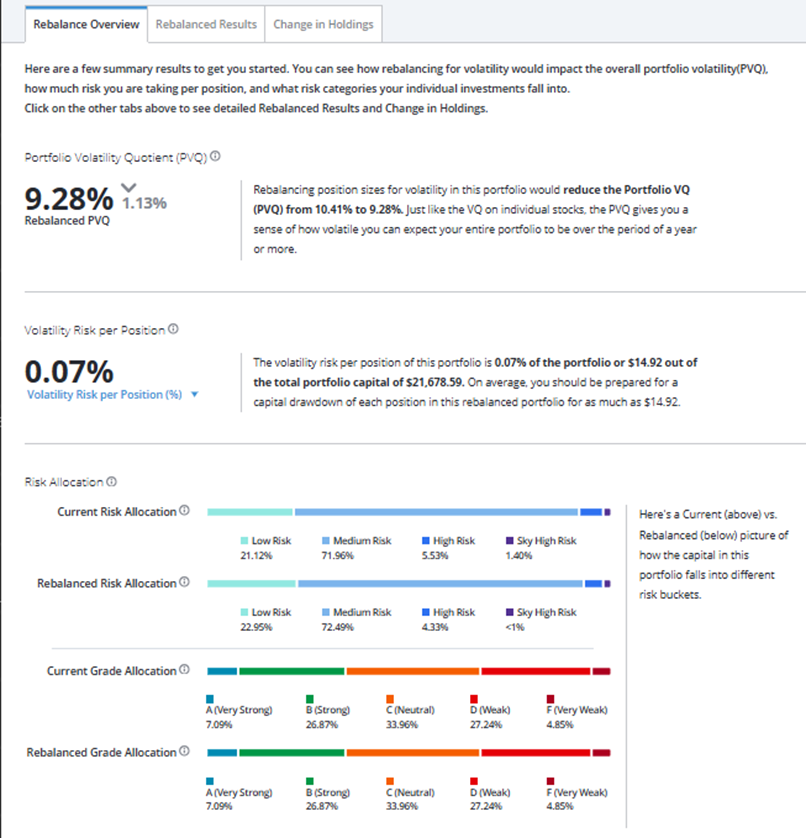
There are two key metrics to focus on here:
1. Portfolio Volatility Quotient (PVQ): The new suggested portfolio drops my PVQ by 1.13% to 9.28%. Remember, we define the risk of any security (or in this case, your whole portfolio) by the VQ. It represents the security’s normal risk based on historical prices.
The portfolio risk (or PVQ) not only considers the VQ of individual stocks you own but also considers the correlation between all the stocks in your portfolio. You will typically have a higher PVQ if the holdings are correlated; that is, tend to move up and down together. When you are diversified, you can potentially hold high-risk securities and still have a lower overall PVQ.
2. Risk Allocation: Scroll down and you’ll find a breakdown of your current risk allocation and the suggested rebalanced allocation categorized by…
- Risk allocation ranges:
- Up to 15% = Low Risk
- 15% to 30% = Medium Risk
- 30% to 50% = High Risk
- Above 50% = Sky-High Risk
- Stock Grade Allocation:
- Strong Bullish,
- Bullish,
- Neutral,
- Bearish, or
- Strong Bearish
The Stock Grade Allocation uses TradeSmith stock ratings for each position, based on our proprietary indicators along with supporting technical and fundamental analysis.
Now click on the Rebalanced Results tab to see your new suggested portfolio allocation, as shown in the example below:
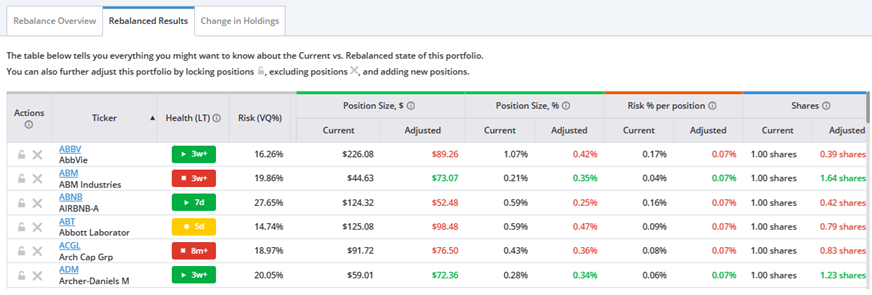
The Position Size columns display the amount of money invested in each position both in dollars and as a percentage.
Numbers in red suggest a decrease in position size, while those in green advise an increase in position size. The Current and Adjusted columns allow you to see a “before and after” comparison at a glance.
The Risk % per position tells you the amount of risk in each stock compared to the value of the overall portfolio. We are risking 2.2% of the entire trading capital per trade. And finally, the Shares column provides your Current share size and how many shares you should have after rebalancing (in the Adjusted column).
This is the equal risk parity method in action.
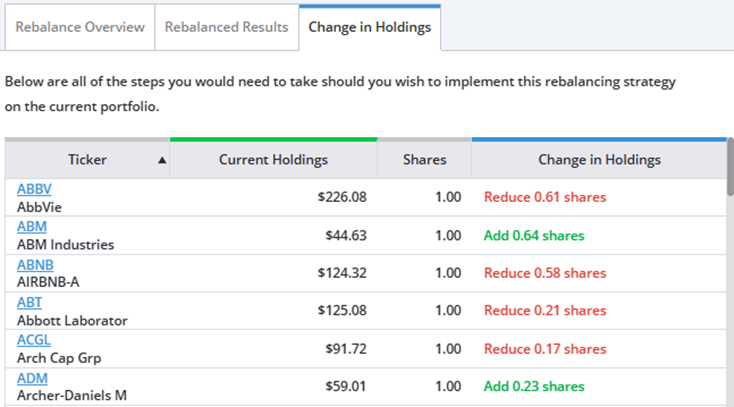
Finally, click on the Change in Holdings tab shown above to see an abbreviated version of the suggested portfolio changes according to our Risk Rebalancer.
You certainly don’t have to make all the suggested portfolio changes, but this is a great exercise to help guide you to a more balanced stock portfolio.
Mike Burnick’s Bottom Line: It’s a great idea to revisit our Risk Rebalancer tool at least once per year to keep your portfolio holdings in proper balance. This can help you by suggesting cuts to poor performing or high-risk stocks, with recommendations you can easily follow.
So, if you haven’t done so already, with 2025 quickly coming to a close it’s a great time to give our Risk Rebalancer tool a test drive before year end.
Good investing,
Mike Burnick
Senior Analyst, TradeSmith