Beyond the Mag 7: Why the S&P 500’s “Other 493” Could Be the Real Winners in 2026
As we head into the new year, investors are facing an important question: Will the same handful of mega-cap stocks keep leading the market… or is leadership about to change?
Because while most investors know exactly what sectors have propelled the stock market higher in recent years, the next phase of may be starting to shift.
Before I explain why, let’s take a look at last year…
In 2025, communications services (Alphabet, Meta Platforms, Netflix, etc.) and technology (Nvidia, Apple, Microsoft, etc.) led the way.
Today, these two sectors combined account for nearly half of the total market cap for the S&P 500 Index. That’s extreme concentration in just a handful of stocks.
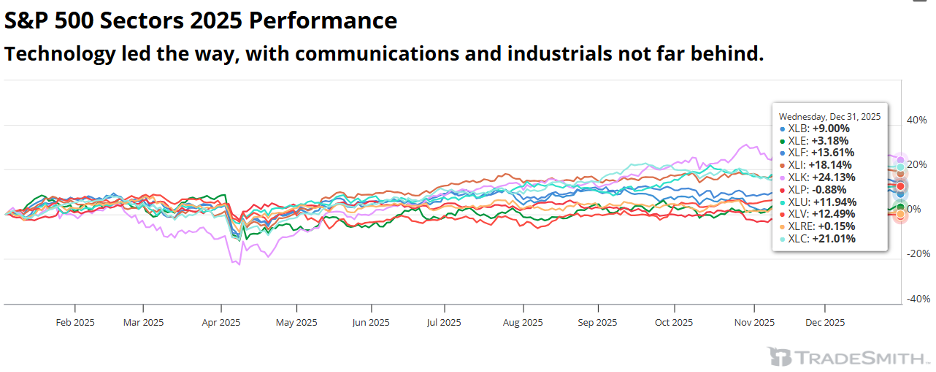
True, the performance for these sectors and their leading stocks has been well-deserved. That’s because the tech and communication services sectors have also contributed the most to S&P 500 profit growth in recent years.
But as the AI buildout accelerates, the “Magnificent 7” stocks will be aggressively competing with one another for a bigger piece of the pie. And increased competition inevitably leads to lower pricing in technology.
That’s why some of the biggest “winners” from the AI race are likely to be the other 493 S&P 500 companies.
After all, it’s not just producers of technology that benefit. Companies of all sizes –and from all sectors – that are consumers of new technology to boost productivity could enjoy a big boost in profit margins!
Going forward, that means earnings growth for the Magnificent 7 won’t look quite as magnificent compared to the other 493.
Plus, I expect accelerating profit growth for small- and mid-cap stocks this year too – which is why it’s time to start looking beyond the Magnificent 7.
Looking Beyond the Mag. 7
Perhaps this is why performance is already shifting in favor of the other 493 relative to the Mag 7.
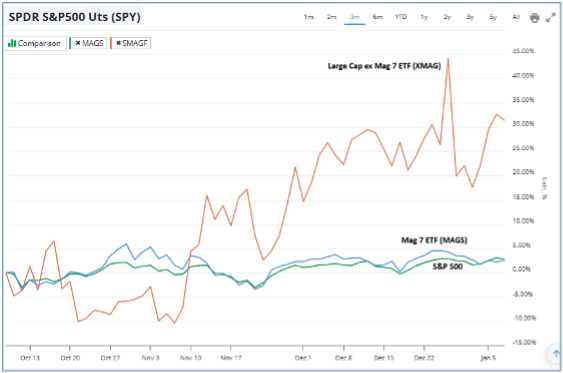
Since the end of October, the Magnificent Seven ETF (MAGS) has underperformed the S&P 500 index, as you can see above.
Meanwhile, the Large Cap ex Mag 7 ETF (XMAG) – which includes the other 493 S&P 500 stocks – has outperformed by a huge margin, up 31.3% compared with a gain of just 2.6% for MAGS!
This shift in leadership makes perfect sense, because the earnings growth differential between the Mag. 7 and the rest of the S&P 500 is narrowing considerably.
Wall Street expects S&P 500 earnings growth including the Mag. 7 of 15.6% in 2026, compared to 13% for the S&P 500 excluding the Mag. 7, and 15.5% profit growth for the S&P SmallCap 600 (SML).
And without much difference in expected growth, there isn’t much of a catalyst for tech and communications stocks – including the Mag. 7 – to outperform.
That’s why I’m looking for other sectors that have a better chance of leading the stock market in 2026.
To find which sectors may have the right stuff, I look no further than our proven TradeSmith long-term Health Indicators.
So, let’s take a look at how to use these tools to identify where market strength is building right now.
Spotlighting the Strongest Sectors
From your TradeSmith Finance platform, simply click on Markets from the main menu bar, then S&P 500 Sectors from the submenu.
Below, you’ll find our current health distributions for each of the 11 S&P 500 sectors. Next, I look for the sectors with the most component symbols in the Health Indicator green zone – which, as of yesterday, included these.
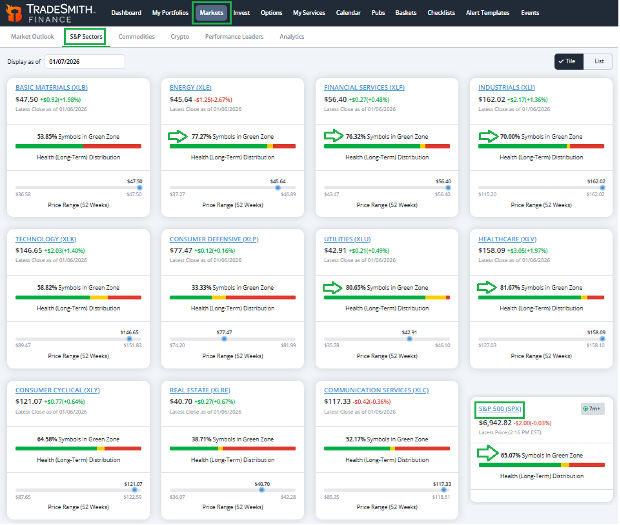
As you can see above, five sectors (highlighted with the green arrows) have more component stock symbols in the green zone than the S&P 500 Index (shown at lower right for comparison).
In descending order, they are:
- Healthcare (XLV): 81.7%
- Utilities (XLU): 80.7%
- Energy (XLE): 77.4%
- Financial Services (XLF): 76.32%
- Industrials (XLI): 70.0%
By comparison, the S&P 500 (SPX) has 65.1% of symbols in the green zone.
Our proven Health Indicator is a great place to start looking for more attractive stocks and sectors. But with a little additional homework, I found extra catalysts that indicate these sectors are either undervalued or unloved – and thus likely to outperform at some point.
- Healthcare is trading at roughly a 30% discount to the S&P 500 on a price-to-earnings basis. And analysts are boosting their 2026 earnings estimates for the sector.
- Utilities are a direct beneficiary of the AI boom, with new electricity demand soaring nationwide due to data center construction.
- Energy is one of the most under owned and unloved sectors by institutional investors today – second only to…
- Financials, which also have the strongest upward quarterly earnings estimate changes of any other sector beside Utilities.
- Industrials have the third-highest 2026 profit growth forecast of all sectors, better than Communications and the S&P 500 overall.
The Industrial, Financial, Healthcare, and Utilities sectors also have a greater weighting of high-quality stocks relative to the S&P 500 overall.
Based on sector valuations relative to operating cash flow, Healthcare has 75% implied upside potential and Energy has 72% upside. And based on free cash flow yield, Industrial stocks have 25% implied upside relative to the S&P 500!
That’s why it makes sense to take a closer look at stocks in these sectors that could potentially outperform in 2026.
An easy way to accomplish this is by setting up a TradeSmith Screener.
Screen for the Next Big Winners
Simply click Invest from the main menu and select the Screener tab.
The Screener tool is available to TradeSmith Platinum members, plus Premium-level (or higher) subscribers to Ideas by TradeSmith, as well as those with Trade360 and TradeSmith Essentials.
Here’s a screenshot of the filters I used:

Keep in mind, I have full access to TradeSmith tools thanks to my Platinum Membership, so you may not see all these features and filters. But if you’d like to add them, simply contact our Customer Care team at 888-623-0858 to find out more.
To build this screener yourself, simply click on + Manage Filters and add the filters shown above:
- Sectors, which you’ll find under the category Market & Classisfication. I included the five healthiest sectors that I mentioned previously.
- Health (Long-Term), which you’ll find under the heading TradeSmith Proprietary Metrics. I set this filter to screen for green zone stocks only.
- Business Quality Score, also under TradeSmith Proprietary Metrics. I added our unique business quality score metric, set to more than 70 (>70). It considers the most critical fundamental factors found in stocks likely to outperform – including profit growth, payout, profitability, and safety.
- Trade Cycles by TradeSmith, I added the filters for Optimal Seasonal Pattern Only, toggled to Yes, and Days to Seasonality Pattern Start Date and set at (<60) less than 60, to find bullish optimal seasonal patterns starting in the next two months.
These are based on the seasonal trading patterns identified by our Trade Cycles algorithms after scanning thousands of stocks.
The Optimal Seasonality filter will screen only for stocks with a Seasonality Pattern Accuracy Rate greater than 80% and a Seasonality Pattern Average Return of at least 4% over the past 15 years.
When I ran this screener yesterday, I got 32 stock results worthy of further research. Many of the results were from the healthcare sector.
Here’s a screenshot of the results sorted by Business Quality Score from high to low:
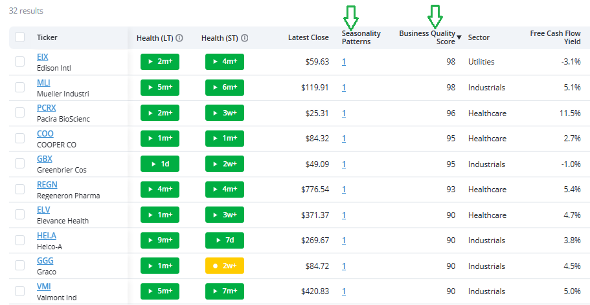
In the Seasonality Patterns column, simply click on the highlighted icon for detailed stats on each stock’s upcoming seasonal pattern.
For instance, aerospace/defense contractor Heico Corp. (HEI) has a bullish seasonal pattern starting Jan. 28 and running through March 5.
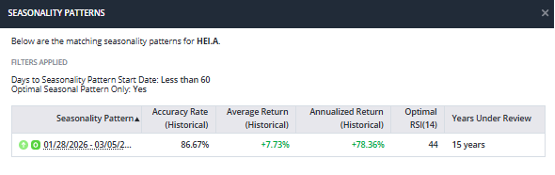
HEI has a historical accuracy rate of trending up 86.7% of the time and has delivered average returns of 7.7% during this period over the last 15 years.
That works out to an annualized return of 78.4% owning HEI just during this bullish window over the past 15 years.
Mike Burnick’s Bottom Line: For my money, many of the S&P 493 stocks may have the best upside potential in 2026 as market leadership shifts. This screen is designed to uncover high-quality stocks in the healthiest sectors of the market that also have bullish seasonal uptrend patterns coming up soon.
Good investing,
Mike Burnick
Senior Analyst, TradeSmith
P.S. If you’re looking for another way to potentially profit from AI’s impact beyond the usual mega-cap names, TradeSmith CEO, Keith Kaplan, recently sat down with my colleagues – brothers Andy and Landon Swan – to break down a unique approach to earnings season. Their proprietary system uses real-time consumer and social data to spot potential AI-driven earnings surprises before Wall Street catches on.
And with earnings season right around the corner, this is another timely way to take advantage of AI’s ripple effects across the broader market – especially in the everyday companies most investors overlook.
As more these companies “weaponize” AI to boost productivity, cut costs, and accelerate growth, it’s creating profit inflection points that often show up first in consumer behavior and online buzz – well before the earnings headlines hit.
But if you don’t know where to look… or wait until the numbers are public… you’ll be hard pressed to profit from those moves.
That’s where the Swan brothers come in. They’re sharing how their system works and the name of their top AI-driven earnings surprise candidate for this quarter – so you can get positioned before earnings season begins.