Profit From The Market Dip with TradeSmith’s Fair Value Tool
Matching the weather across most of the country, the U.S. stock market finished January on quite the cold note.
The benchmark S&P 500 Index was slammed by back-to-back losses on Thursday and Friday, closing last week on a sour note. That’s due in part to some unexpectedly disappointing earnings reports – most notably from tech giant Microsoft (MSFT).
Still, you have to keep in mind that these sudden downdrafts in the market come with the territory: When stocks trade at such rich valuations, prices can fall fast.
Just don’t take the end-of-week downturn as a reason to panic. Taking a closer look under the hood, we can see that the majority of S&P 500 sectors still look quite healthy right now… despite last week’s drama:
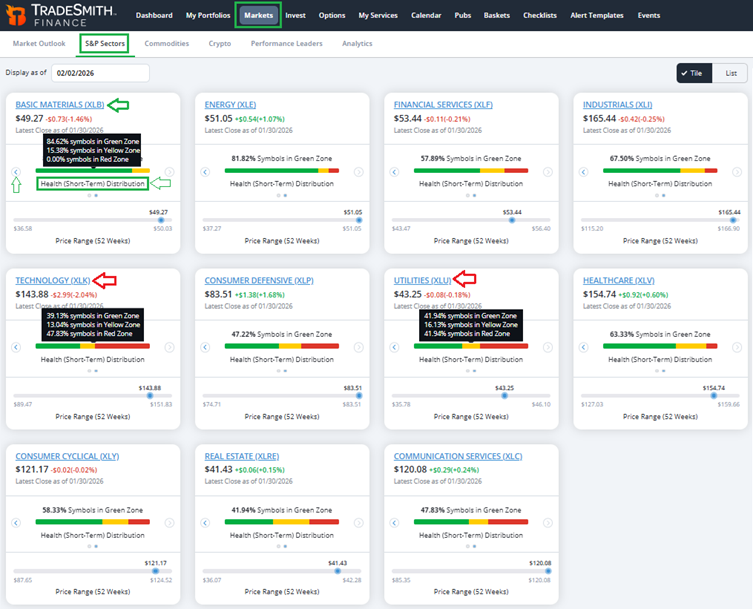
To see what I mean, simply navigate to the Markets page of TradeSmith Finance and check out the Market Outlook and S&P Sectors tabs.
Here you can review each sector of the S&P 500 Index at a glance, thanks to TradeSmith’s Short-Term (ST) Health Distributions.
I like to drill down into the 11 individual S&P sectors by checking in on how many stocks within each sector are in the Short-Term Health Green Zone. For my money, that’s the best way to see what’s hot and what’s not.
And right now, the Materials (XLB) and Energy (XLE) sectors look the hottest, with 84.62% and 81.82% of the stocks in these sectors currently in the ST Health Green Zone, respectively.
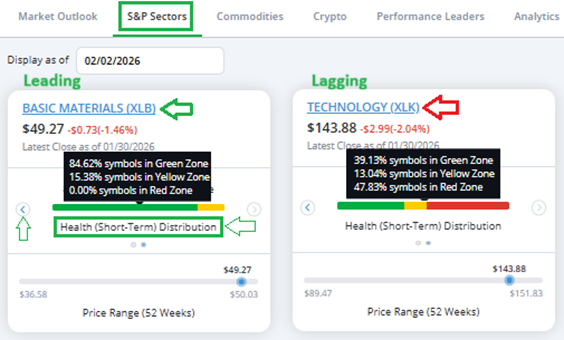
XLB has zero stocks in the Red Zone, while XLE has only 9% in the Red. In other words, these are clearly the sectors and stocks that are leading the stock market right now.
As for which sectors are lagging the market at the moment… the ST Health distributions make that very clear.
The Technology (XLK) sector stands out here, as shown above, with more of its stocks in the Red Zone (47.83%) than the Green Zone (39.13%).
That’s a bad sign for the S&P 500’s biggest sector by weight. Based on the ST Health data, stocks in this major sector could be in for a bigger correction…
So, if you are looking to buy the dip after last week’s decline, I would consider focusing on the healthiest sectors, like Materials, Energy, and perhaps Industrials (XLI). Likewise, you may want to tread more cautiously with Technology stocks, at least until the sector’s Short-Term Health improves.
Make Smart Options Trades With The Fair Value Tool!
When stocks decline sharply over just a few days, it can be tempting to buy in just as fast while hoping for a quick recovery. Many investors take this approach by buying shares, while others enter short-term options trades.
But long-time readers of Inside TradeSmith will know that I’m a big fan of the slow-and-steady approach – and that I prefer to be cautious in the wake of a quick market downturn.
Like-minded investors may want to consider selling the dip: By selling put options on the healthiest sectors and stocks while they’re still weak, you can earn quick income while aiming to buy stock at more attractive prices.
That’s where our exclusive Fair Value Options tool comes in handy.
This TradeSmith tool compares the latest market price of any option to our own internal calculation of its fair value, based on fundamental market data.
This way, you can know up front if you’re getting MORE or LESS than your money’s worth before making your next option trade.
- A buyer of call and put options should look for undervalued options that you can buy for less than the fair value price…
- While a seller of call and put options should look for options that are overvalued compared to the fair value, that you can sell for more while they’re hot.
Using our Fair Value tool, you can potentially profit from price inefficiencies in the options market and earn yourself a bit of extra income in the process.
And you can see all the information you need in just one simple graph.
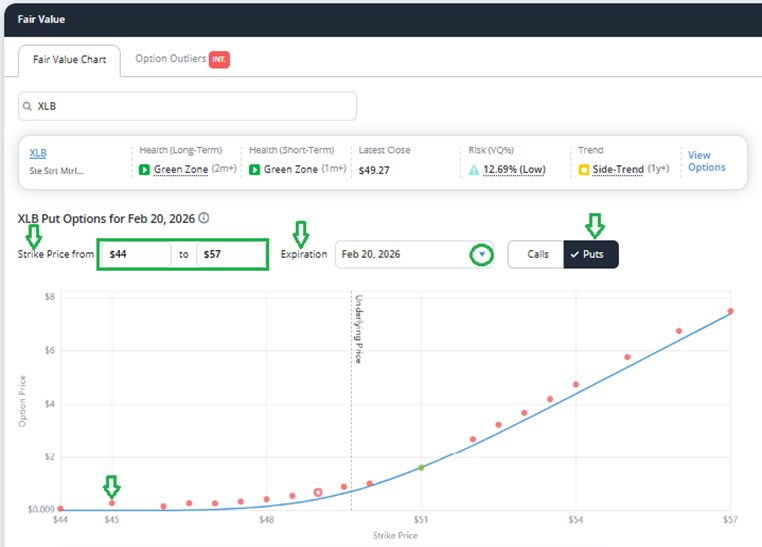
Below, you can see the Fair Value graph for XLB put options. It shows, at a glance, if the market price of any option on XLB’s options chain is statistically cheap (below the blue line) or expensive (above the blue line) relative to our fair value calculations:
To access the Fair Value tool, simply log into your TradeSmith Finance account, click on the Dashboard page from the main menu, and scroll down to find the Fair Value widget.
Keep in mind, the Fair Value Options tool is only available to TradeSmith Platinum and Options360 members. If you don’t see the Fair Value tool on your platform, keep reading to learn more about getting access.
In the Search for Ticker box, you can type the symbol for any stock in our database to scan its option chain for fair value data.
As you can see above, you can select from a range of different option strike prices and expiration dates, or choose between call or put options by using the toggle to the right.
For today’s example, let’s say I’m looking to sell a put option on the S&P 500 Materials Sector ETF (XLB), in an attempt to get exposure to this leading sector at a discounted price – and earn income in the process.
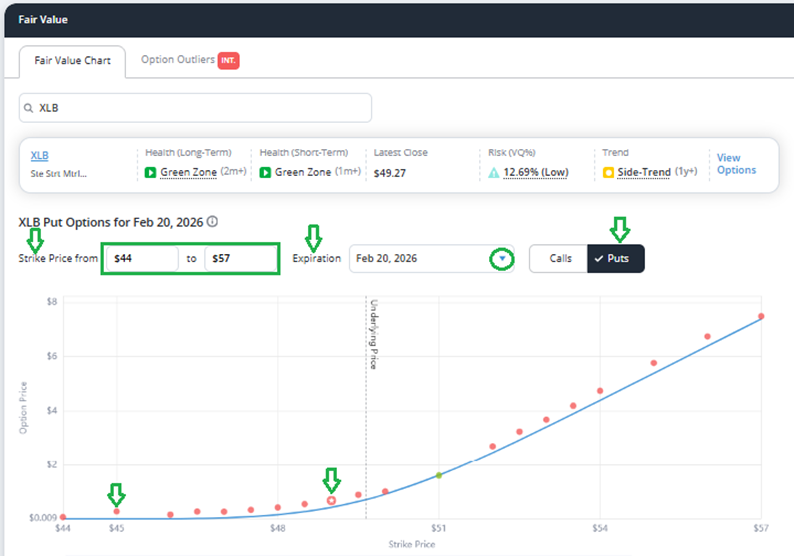
I want to enter this position sooner than later, so I’ll use the Fair Value tool to scan options contracts with the Feb. 20, 2026 expiration date, as shown below:
I’m focusing only on put options that are out of the money, and so I’ll look at points to the left of the underlying price (the vertical dotted line above).
Once again, the blue line on the Fair Value graph represents the theoretical fair value price curve for each option on the chain, as calculated by our internal algorithms. The dots on the line indicate the current market price of each option.
When the dots are above the blue line, it means the option price is overvalued, and you can potentially get more than your money’s worth by selling the option.
Dots that appear below the blue line are undervalued, while dots at or close to the blue line are close to fair value.
Simply hover over any dot with your mouse to view details about how under- or overpriced the option is, according to our analysis.
For example, let’s zero in on the XLB Feb. 20, 2026 $45 put option below:
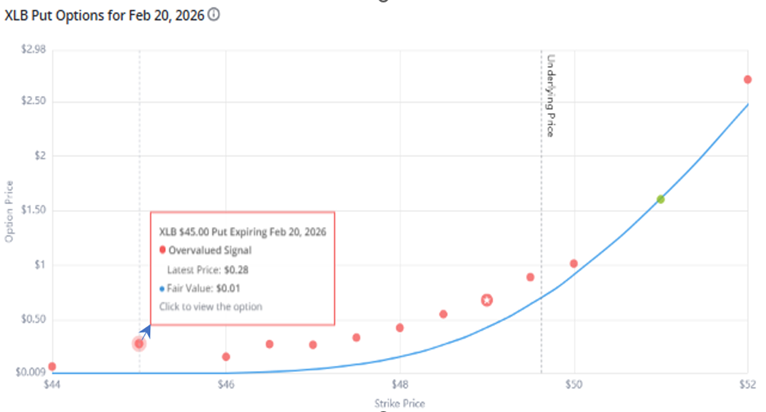
The latest price is $0.28, according to the live options market. But according to our calculations, its fair value is just a single penny!
With this in mind, you could sell this option and pocket $28 per contract, when the actual fair value of the option is only $1. And if XLB doesn’t reach the strike price by the Feb. 20 expiration date, that’s money you can keep – with no further strings attached!
That’s a potentially profitable mispricing that you can take full advantage of.
Mike Burnick’s Bottom Line: If you’re looking to buy the dip using put or call options, it’s critically important to know if they are overvalued or undervalued.
Our Fair Value Option graph displays the market price of any option compared to its data-driven fair value, to give you a valuable trading edge you won’t want to ignore.
Good investing,
Mike Burnick
Senior Analyst, TradeSmith
P.S. The Fair Value Options tool is one of TradeSmith’s newest developments – it’s one of the smartest ways to spot mispriced opportunities in the market, and it’s one of my favorite market-scanning tools in the TradeSmith arsenal.
But what you may not realize is just how powerful this tool really is.
That’s why TradeSmith CEO Keith Kaplan has pulled back the curtain in his T-Day Summit, to show off all that this technology can do. By identifying price inefficiencies in the options market, the Fair Value tool has pinpointed trades capable of delivering 113% gains in one hour… 172% in four hours… even 600% in just one hour.
It’s no exaggeration to say this could be the start of a new era in trading – much like the birth of options trading in 1973 or the first ETF in 1990.
If you don’t have access to this powerful tool yet, don’t wait.
Watch Keith’s T-Day Summit webinar now, and see the fair value tool in action.