After 47 Years, the “King of Quants” Just Found His Biggest Edge
Listen to the audio version of this article (generated by AI).
Louis Navellier’s career began with a college project he couldn’t get right.
This was the late 1970s. A professor at Cal State Hayward (now Cal State East Bay), where Louis was studying finance, was consulting for Wells Fargo.
He was helping the bank work on a new idea: funds that simply tracked the market, rather than trying to beat it. And he brought Louis in to help.
The professor gave him a specific task: Use Wells Fargo’s mainframe computer to build a portfolio of 320 stocks that tracked the S&P 500.
Louis couldn’t do it. No matter what he tried, his 320-stock basket kept beating the index they were supposed to mirror.
This was back when the Efficient Market Hypothesis ruled supreme. The consensus in academia and on Wall Street was that consistently outperforming the market was essentially impossible.
But Louis’ model kept proving otherwise. So he dug into why.
What he found shaped his entire career… and blazed a trail for computer-based “quant” investing.
The stocks that beat the index had something in common. They moved independently of the market — climbing not because the tide was rising, but because the underlying business was exceptional.
And those outlier companies left a pattern in the data… if you knew what to look for.
Louis spent the next 47 years refining that discovery. The result was Stock Grader — a quantitative stock-selection system that spotted Microsoft when it traded for 38 cents, Nike when it traded for 33 cents, and Nvidia in 2005, long before it became the world’s most valuable company.
I’ve followed Louis’ career for most of mine. His success in finding alpha using computers and market data is an inspiration for what we do at TradeSmith.
So I recently called him with an idea about how we could combine the power of Stock Grader with some new tools we built at TradeSmith.
I was confident our systems could help Louis improve his already-stellar results. What I didn’t expect was the effect his system had on lifting ours.
I’ll get into those results today. First, if you’re not already familiar with Louis, you should know why folks in the press call him the “King of Quants.”
An Icon Among Growth Investors
Louis didn’t keep his discovery locked inside academia.
He launched his first newsletter, MPT Review, in 1980 and his money management firm, Navellier & Associates, in 1987.
In 1996, USA Today ran a profile under the headline: “Money Manager Wins with Momentum.”
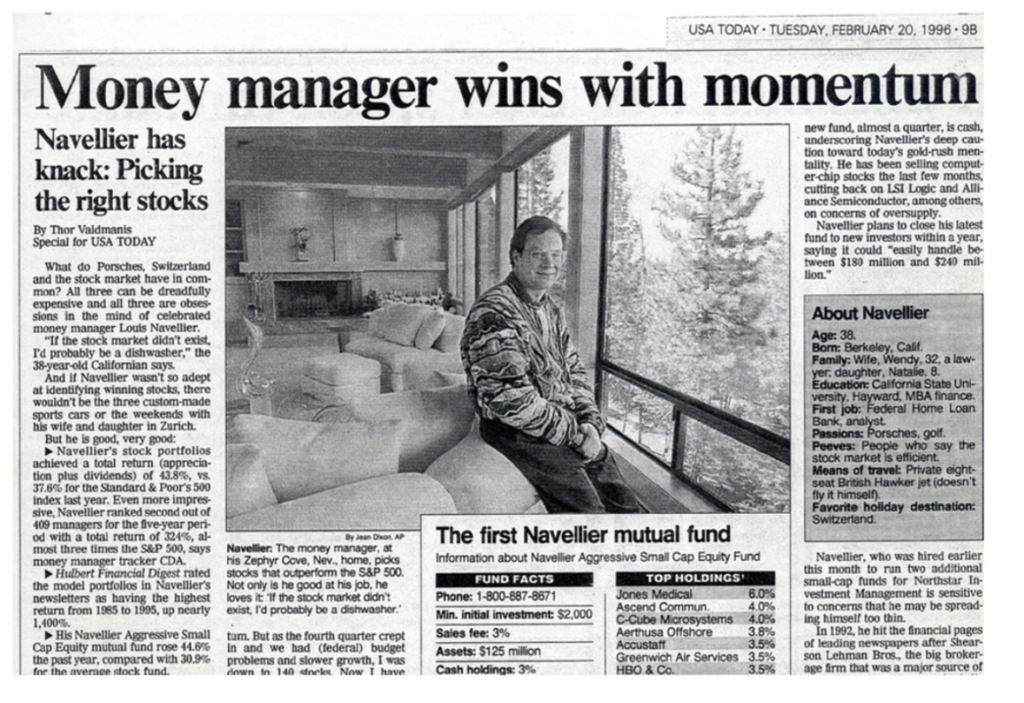
At the time, he was 38 years old and managing $1.5 billion in private accounts. Over the prior five years, he’d ranked second out of 409 money managers — with a total return of 324%. Nearly three times the S&P 500.
And Hulbert Financial Digest rated his newsletter portfolios as the highest-returning in the country over the prior decade. Up nearly 1,400%.
But as striking as they were, it wasn’t just his returns that interested the press. It was how he was making them.
Louis wasn’t poring over company reports or charts like most money managers at the time. He was using computers to find growth stocks that outperformed the market.
Most of Wall Street thought that was a losing approach. The numbers said otherwise.
Louis’ Stock Grader system has flagged 676 stocks that doubled or more — including 22 that went up 100 times in value.
That’s why Forbes called Louis the “King of Quants.” It’s also why The New York Times called him an “icon among growth investors”… and Barron’s called him “one of the most successful fund managers and financial newsletter editors in the country.”
And just in the past couple of years, his recommendations have included Sezzle (SEZL), up more than 340% in about 18 months… Celestica (CLS), up more than 560%… Bloom Energy (BE), up 1,040% in just over a year…
Anyone who put $5,000 into each of those three picks would be sitting on more than $111,000 today.
I’ve spent 20 years building investment software. And I’ve never come across a stock-picking record that good. To stay at the top over nearly five decades is just not something you see very often.
So when our systems started flagging something I’d never seen before — a fundamental change in how markets move — Louis was the first person I wanted to talk to.
Whipsaw Moves Are Now the Norm
As I’ve been spotlighting in these pages, the market has grown incredibly reactive. Whipsaw moves that used to be outliers are becoming the norm.
The data is clear on this. The 20 largest single-day point swings in market history have all happened since 2020.
Not most of them. All of them.
Crashes that used to unfold over months now happen in days. The 2008 financial crisis took 18 months. The Covid crash took about a month. The 2025 Tariff Tantrum lasted four trading days. The software selloff earlier this year wiped out $285 billion in 48 hours.
Stock Grader was built to find the best stocks. And it does that better than anything I’ve seen.
But finding the right stock is only half the battle. The other half is holding it long enough to capture the gain — without getting shaken out by the kind of violent short-term swings that have become the new normal.
That’s the challenge I called Louis about. Together, we found a solution that surprised us both.
A New Kind of Edge
We started by pairing our new short-term market timing indicator with Louis’s A-rated stocks, the ones with the strongest fundamental business health.
We designed it specifically to help you avoid the fast, painful, whiplash selloffs that are becoming more and more routine.
When we ran the two systems together, the combination outperformed either one alone.
Then we went a step further. We built a proprietary AI model — trained on years of market data — that identifies which of those stocks have the strongest short-term profit potential right now. It adds a layer of pattern recognition that neither system had before.
The numbers tell the story better than I can.
Stock Grader alone would have gotten you into these stocks. But with our timing signals and AI layer telling you when to get in and out, you can dramatically boost those returns. For example…
- A 4% gain on Dover Corp. (DOV) became 1,341%.
- A 292% gain on Broadcom (AVGO) became 6,284%.
- A 9% loss on Fastenal (FAST) — a stock that was going nowhere — became a 463% gain.
Since 2021, our testing shows that owning just five of these stocks at a time could have turned $10,000 into $56,010 — more than three times the S&P 500.
I thought our systems would sharpen Louis’ results. And they did.
What I didn’t expect was that Stock Grader would sharpen ours. Our signals work significantly better when applied to fundamentally strong stocks — the kind Louis has spent 47 years tracking. Each system was lifting the other.
Louis called it the most important upgrade to his Stock Grader system. I’d say the same about what it did for ours.
We’re hosting a free event on June 10, at 10 a.m. Eastern to walk through it — including a stock our new system says to buy right now and one to avoid.
And look out for more on our new collaboration with Louis in these pages over the next few days.
I’ve spent 20 years looking for an edge in the market. Working with him — and seeing both our systems improve in the process — is about as good as it gets.
All the best,

Keith Kaplan
CEO, TradeSmith
P.S. Louis has one more thing he wants to share on June 10 — and it has nothing to do with the new system.
He’s been watching the market closely this year, and he says 2026 is tracking 1999 almost exactly. That was a year that ended brilliantly for investors — but not before a rough summer.
He’ll walk through what he’s seeing at the event. And why the new system we’ve built together can help you navigate what’s coming. Here’s that link again to register.