This TradeSmith Screener Finds The Small-Cap Stocks Outperforming The S&P 500
Despite recent volatility – and one rough break in the S&P 500’s weeks-long winning streak – the stock market has pulled it together. Indexes jumped back toward new highs last week.
This return to form was helped by the successful launch of SpaceX (SPCX), of course: it certainly doesn’t hurt to have the largest IPO of all time pushing things along!
But despite last week’s big focus on tech stocks, it wasn’t the usual suspects, like the “Magnificent 7” mega-caps, that led the way higher.
Instead, it was the stock market’s small fries leading the charge.
The S&P Small Cap 600 Index (SML) hit a new all-time record high last week, ahead of the benchmark S&P 500 Index (SPX) and the tech-dominated Nasdaq 100 Index (NDX). And that’s no surprise, either: This outperformance from small-cap names is nothing new.
As you can see in the chart of SML below, small caps have been consistently making new highs this year, often ahead of the larger indexes’ own highs. SML (charted in green) has been outperforming SPX (in blue) by a wide margin, too:
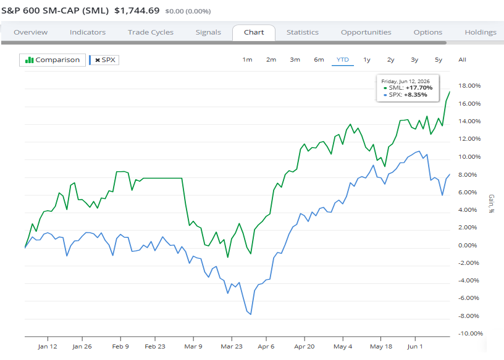
In fact, small caps are up 17.7% this year – more than twice the 8.3% gain of the large-cap S&P 500!
But it’s not just stock prices that are higher after the SpaceX launch. I’ve noticed that overall market breadth has also improved since last week.
That means more advancing than declining stocks, plus more stocks making new highs than lows.
Considering how crucial market breadth is for stock market health, that’s a great sign. And once again, when you look closer it’s small-cap stocks leading the way…
As of Friday’s close, 42 stocks in the S&P 500 notched new 1-year highs.
The Small Cap 600 Index, on the other hand, had more than twice as many new 1-year highs, with 92 stocks on the rise!
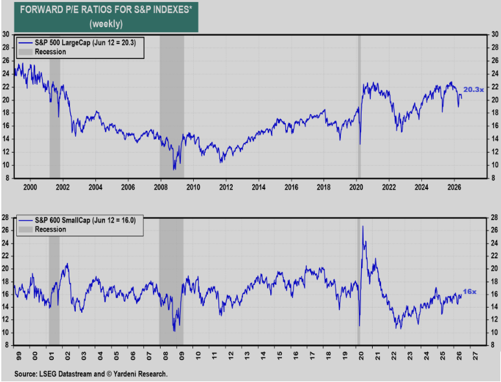
And perhaps best of all, these rising small caps are much more reasonably valued than their large-cap cousins.
As you can see in the chart below, the S&P 500 (upper chart) has a forward price/earnings (P/E) ratio of 20.3x today. By contrast, the S&P 600 (lower chart) looks like a bargain with a P/E ratio of just 16x:
Skies are looking clear for stocks right now – and between superior performance, better breadth, and more reasonable valuations, conditions are looking to favor small-cap stocks!
With these advantages in mind, I ran straight to the TradeSmith Screener tool. Today, we’ll take a look at my favorite small-cap screener, with a few tweaks, to show you how our tools can uncover today’s best small-cap stock opportunities.
Find The Market’s Small-Cap Leaders With This Tiny & Mighty Screener!
To follow along and build this small-cap screener for yourself, just log into your TradeSmith Finance Dashboard. Once you’re on the platform, open the Invest page from the main menu, then click on the Screener tab in the following sub menu.
TradeSmith’s powerful Screener tool is available to members with subscriptions to Ideas by TradeSmith, Trade360,and TradeSmith Essentials, as well as our valued TradeSmith Platinum members. If you don’t see it in your platform, and you’d like to, simply contact our Customer Care team at 888-623-0858 to find out how to get access.
Now, we just need to add three simple filters to search for quality, low-volatility stocks in the high-flying S&P Small Cap 600:
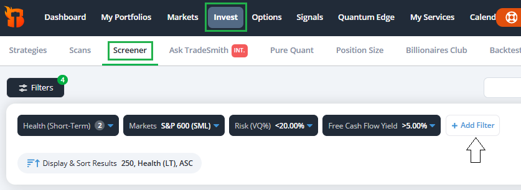
These key screener filters are, in the order shown above…
- Health (Short-Term), set to find stocks in the Green or Yellow Zones…
- Markets, set to search the S&P 600 (SML)…
- Risk (VQ%), looking for scores of less than 20%…
- And Free Cash Flow Yield, set to select stocks with yields of more than 5%.
Simply click on the blue + Add Filters button to add these filters to your screener, along with any other filters you prefer to search with.
For this screener, however, I just want to zero in on healthy stocks in the S&P 600 Index, based on the data from our proprietary Short-Term Health indicator. Stocks in the Green Zone and Yellow Zone are more likely to continue their strong upward moves, giving us more opportunity to profit.
Next, I want to stick with lower-risk stocks right now, with market volatility on the rise.
So, I screened for stocks with a Volatility Quotient (VQ%) of 20% or less. These are stocks that TradeSmith’s cutting-edge algorithms have determined to carry low to medium risk, based on these ranges:
VQ Risk Range
- Up to 15% → Low Risk
- 15% – 30% → Medium Risk
- 30% – 50% → High Risk
- 50% and above → Sky-High Risk
And for those curious, we’re looking at stocks in the S&P 600 – instead of other indexes like the more varied Russell 2000 – because Standard & Poor’s screens small-cap stocks for profitability before qualifying them for index entry.
That means that every stock we find in our search is guaranteed to be profitable as-is, with room to grow further. And because I’m looking for strong performers in a good position to continue leading the market, I want to focus on stocks with strong Free Cash Flow (FCF) yields as well. The filters above are set to screen for by FCF yields above 5% – about two times higher compared to the average S&P 500 stock.
When I ran this screener yesterday with the filters above, I got 23 results. The top 10 are displayed below, sorted by Business Quality Score (BQS):
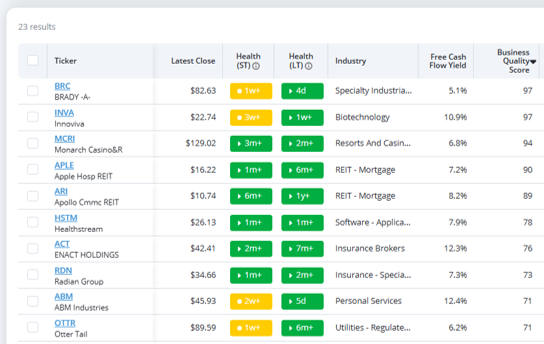
By sorting by BQS, we can quickly see which of these strong small-cap stocks are ranked highly by our TradeSmith tools – but you could also sort the list by Free Cash Flow yield, Short-Term Health, or any of your favorite metrics.
Bottom Line: Although large-cap stocks dominate the indexes and the headlines, small caps outperform them by a wide margin. That’s been true all year.
As more small-cap stocks hit new highs, with cheaper valuations than their large-cap siblings to boot, it makes profitable small caps worth a closer look. For my money, these stocks could be some of the best opportunities on the market right now.
Good investing,
Mike Burnick
Senior Analyst, TradeSmith
P.S. Over the years, TradeSmith has developed a wide arsenal of powerful investment tools, including the Screener tool we used today. It’s all part of our mission to help everyday investors like you find the best trades on the market, and to help you manage your portfolio like a hedge fund while you do it.
Our team of researchers and software developers are constantly working to improve that arsenal, while improving your experience and results in the process. And just last week, we took a huge step forward as a company – all thanks to one new tool.
TradeSmith’s CEO, Keith Kaplan, believes it could be the most important upgrade to the TradeSmith platform since its founding. That’s why he went live last week with a special broadcast, highlighting the new tool and how it works.
It’s a brand-new way to use AI, and a major upgrade to one of our flagship software offerings – one that could’ve turned a 292% gain on Broadcom into a 6,284% gain, and a 47% gain on Visa into a 263% gain during our backtests.
It even has the potential to turn losing trades into big winners… and for my money, with volatility rising across the market, it couldn’t have come at a better time.
Our CEO Keith isn’t the only one excited about it, either: Louis Navellier, investment legend and Senior Analyst at our corporate partner InvestorPlace, joined him in last week’s broadcast to help reveal this new upgrade… and while he was at it, Louis shared a prediction that could change your entire summer.
If you haven’t heard the news, you’ll want to act fast: Tonight is your last chance to catch this broadcast before it’s gone.
Click here to get all the details from Keith and Louis – and find out more about our latest upgrade.