Why This Red Zone Stock Is a Short-Term Buy
Listen to the audio version of this article (generated by AI).
Our data suggests KKR & Co. (KKR) should rise from now until July 28.
But if you want to trade the stock on Monday, don’t do it until you’ve read my interview with our Chief Quantitative Strategist, Mike Carr, below.
If you’re a paid-up TradeSmith subscriber with access to our bedrock trend indicators, you may have already pulled up the chart of KKR and found a reason to doubt me.
But I sat down with Mike this week to explain why this specific setup is so attractive right now because of what you’re seeing, not despite it.
Stick around until the end, and you’ll learn how to access seasonality data on thousands of stocks we track for a limited time. And you’ll learn how we’re set to integrate TradeSmith’s closely guarded AI algorithms into Seasonality for the first time ever.
Let’s get into it…
TradeSmith Daily Editor Michael Salvatore: Mike, you came to TradeSmith a few years ago, and one of your first big projects was our Seasonality software.
For folks new to the concept, seasonality is the study of when markets tend to move throughout the year – down to individual stocks, sectors, even cryptocurrencies. If a price moves a certain way during consistent calendar windows, that can give you an edge.
You looked at our Seasonality software when you got here and found a lot of ways to make it better. So let’s start there. How did you approach it?
TradeSmith Chief Quantitative Strategist Mike Carr: Over my decades trading and designing strategies, what I learned is that you should never rely on just one indicator.
Seasonality alone is a useful piece of information – it shows you when certain assets have historically outperformed. But just because something has happened in the past doesn’t mean it’ll happen again in the future.
So to confirm seasonality, we found that momentum indicators like the Relative Strength Index (RSI) helped us improve seasonality a great deal.
Michael Salvatore: So we started confirming seasonality with RSI – a standard momentum gauge that runs on a scale of 0 to 100. High readings mean a stock has run up hard and may be overbought; a low reading means it’s beaten down.
But now your research team took that a step further with our Short-Term Health Indicator. Tell me about that research, and why we’re bringing it into the software.
Mike Carr: We’re constantly looking at everything we can to improve all our software and strategies. And one of the things we developed recently is the Short-Term Health Indicator.
Longtime readers will be familiar with our Long-Term Health Indicator, based on a stock’s historical volatility and designed for long-term investors.
But not everyone is a long-term investor. And especially if you’re trading seasonal windows that rarely last longer than a few weeks, you want something quicker – something that gets you out and back in on a shorter timeframe.
Short-Term Health does that. It signals near tops and bottoms much better than Long-Term Health for that shorter horizon, which was exactly our goal.
And it worked so well that we started combining it with other tools we have. The first one we’re showing here is seasonality.
What we found was a simple progression. Seasonality on its own is good. Seasonality with a momentum confirmation from RSI is better. And seasonality with RSI and Short-Term Health is better still.
Michael Salvatore: So for readers who aren’t familiar with Short-Term Health: We divide it into three zones, just like Long-Term Health. Green is a buy signal, Yellow is a caution zone, and Red is a sell signal. They represent different stages of momentum.
Now, intuitively, if you were putting on a short-term trade, you’d think you’d want Short-Term Health flashing green – a healthy uptrend – alongside a green seasonality window.
But Mike, you found the Red Zone is actually the better confirming signal. Do I have that right? And if so – why?
Mike Carr: When we started the research, we fully expected to find that a consistent seasonal window with a Green Short-Term Health Zone would be the optimal setup.
But that’s not what the results showed.
Instead, we found that when Short-Term Health is Yellow or Red, that’s a much better signal.
It sounds so counterintuitive, and anyone familiar with our indicators has to be full of doubt reading this. But that’s what the data shows.
If you trade the seasonality windows with stocks in the Red, the average gain from those trades improved by 49.6%.
Michael Salvatore: Mike, I understand you brought a couple of past examples – stocks where a seasonal window opened and Short-Term Health flashed Red or Yellow. Walk me through them.
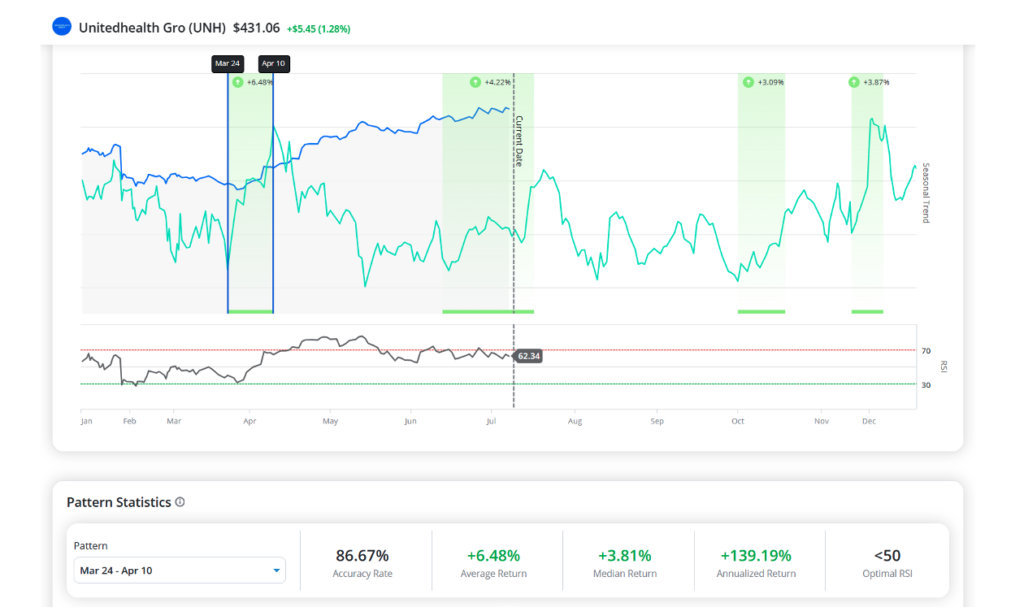
Mike Carr: Sure. UnitedHealth Group (UNH) is a good one. Here’s our typical seasonal chart. Earlier this year, we had a seasonal pattern that began March 24 and ended April 10. The optimal RSI for that window was below 50, and as we entered the window, RSI confirmed it.
Now let’s look at Short-Term Health. This was back in March – and as you can see, UNH was in the Red Zone.
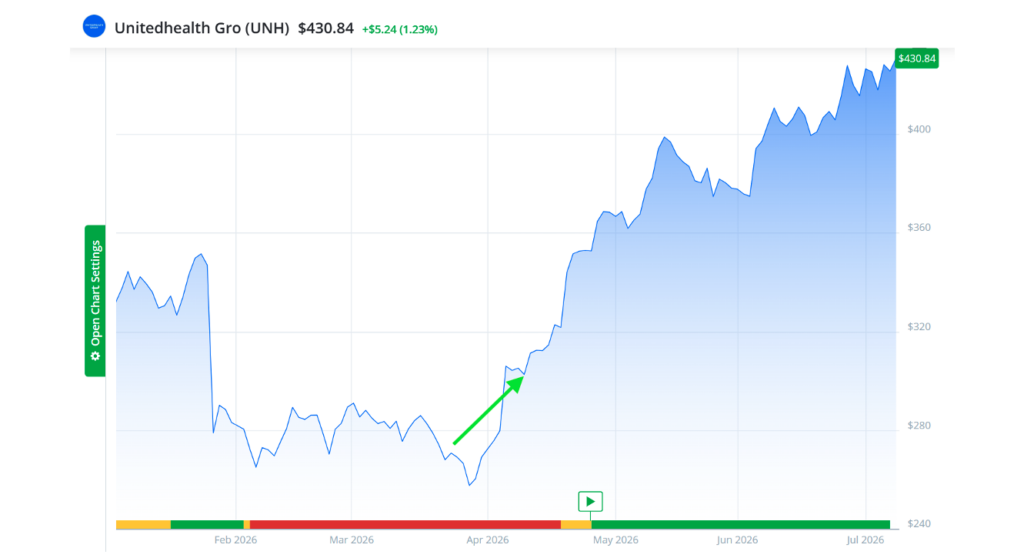
Almost right on schedule, the stock turned up. It entered the seasonal window at $270 and ended it at $302. We think that Red Zone made it more attractive than it otherwise would have been. And it was a big gain from there.
Michael Salvatore: The stock actually flipped into the Green Zone a couple weeks later, and since then it’s kept running and surged over $430.
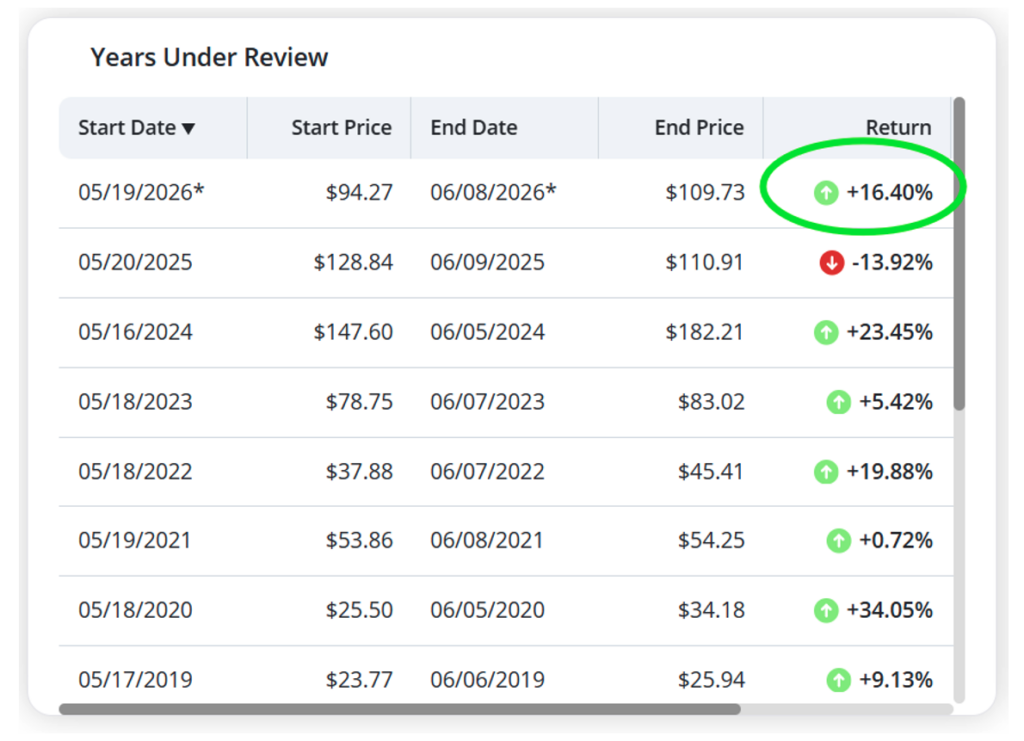
Mike Carr: Right. Another example is Deckers Outdoor (DECK). We saw a seasonal window coming up more recently, from May 19 to June 8.
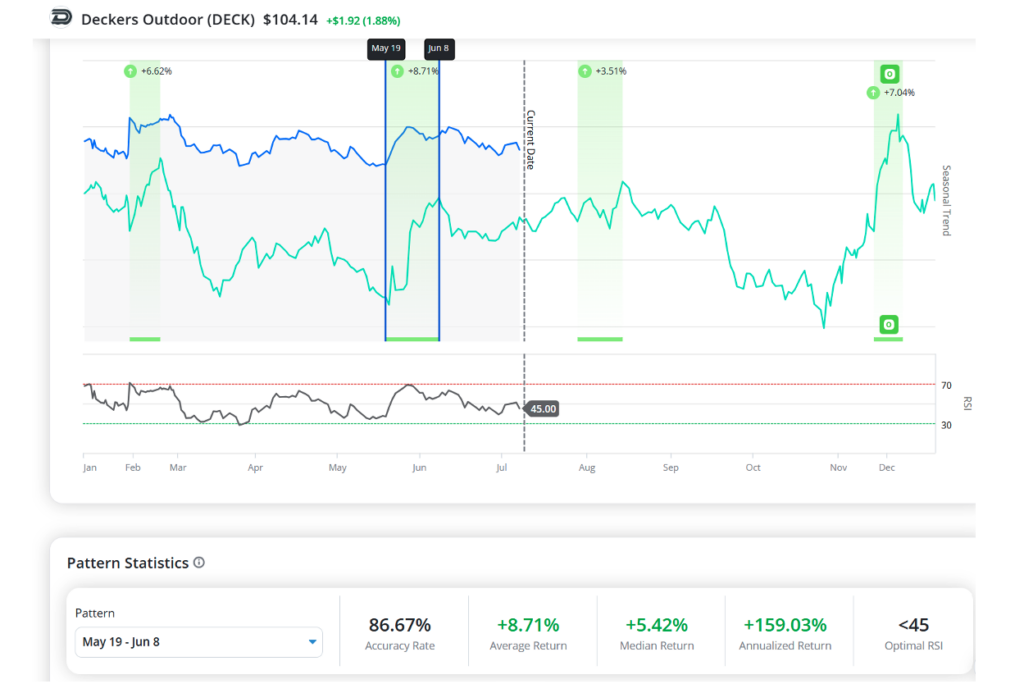
That window is 86.7% accurate historically, with an average gain of about 8.7%. This year, we saw double that after the stock entered the seasonal window while in the Red.
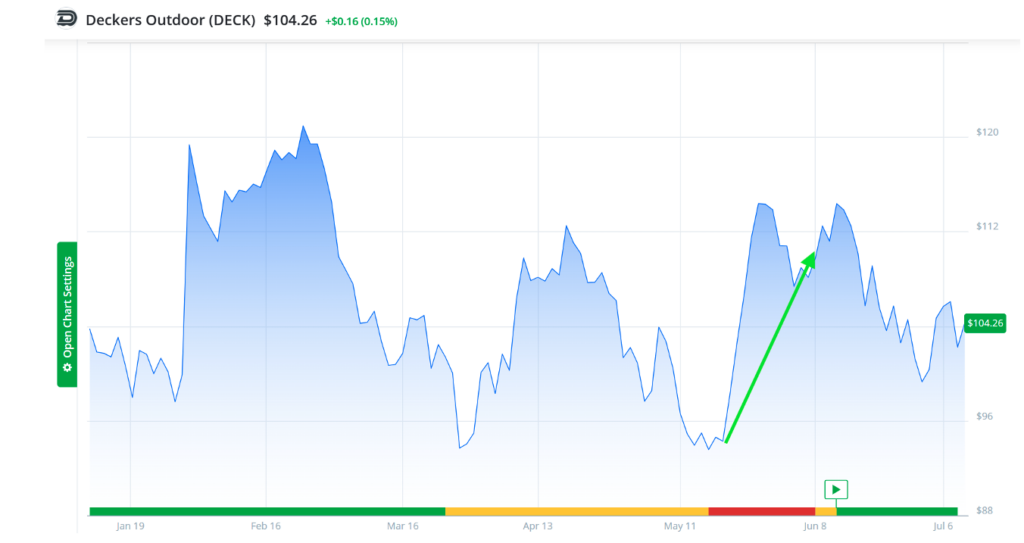
Michael Salvatore: The record shows this year’s trade returned 16.4% – from $94.27 on May 19 to $109.73 on June 8.
And we have an active trade setup right now that we can talk about. Tell me about what we’re seeing in KKR.
Mike Carr: KKR just triggered what we call Seasonal Synergy. That’s a special flag that appears when a high-win-rate seasonal pattern lines up with an optimal RSI reading at the very start of the pattern.
It doesn’t happen on every stock, and it doesn’t happen often. When it does, it’s telling you the two independent signals agree.
For KKR, the seasonal window opened on June 29 and runs through July 28. Historically that window is 100% accurate over 15 years, with an average gain of 8.8% and a median of 10.2%:
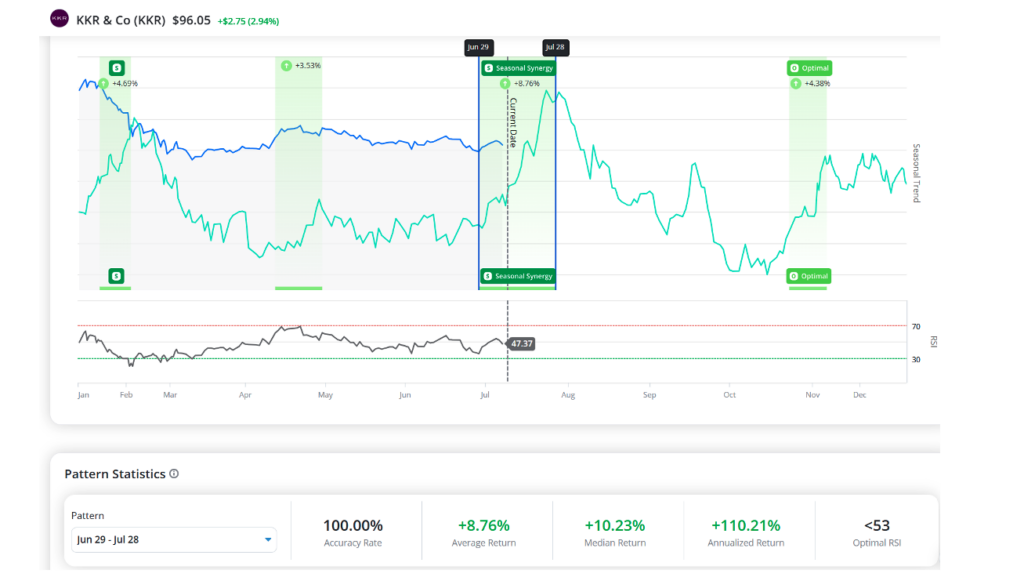
For this window, the trade works best when RSI is below 53 – that’s the optimal level our testing found for this specific stock. When the window opened, its RSI was at 35, so well within optimal range.
Michael Salvatore: And Short-Term Health?
Mike Carr: That’s the part that ties back to everything we just discussed. KKR is in the Red Zone right now. It had a sharp dip at the end of June – you can see it right here – and it’s just starting to recover.
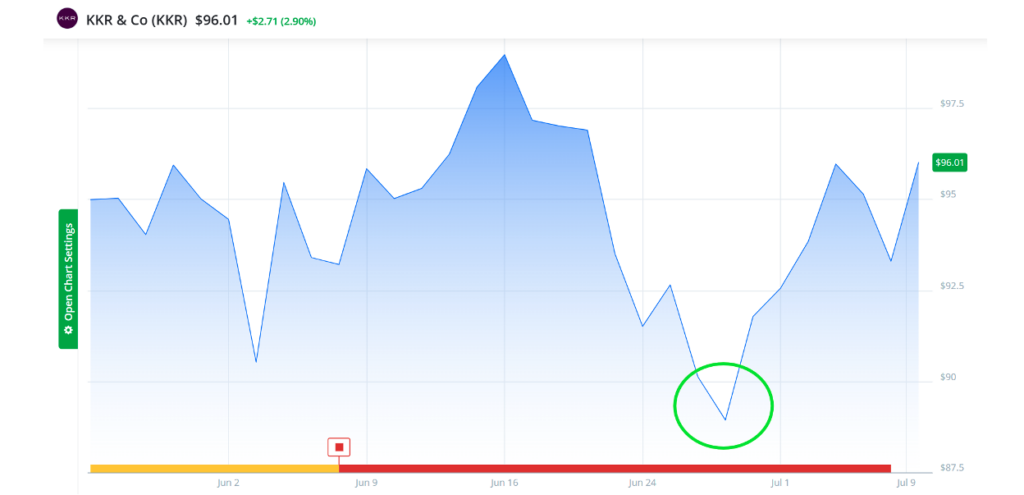
Mike Carr: So this is the full setup in one stock. A seasonal window with a flawless 15-year record. RSI confirming below the optimal threshold – that’s the Seasonal Synergy flag. And Short-Term Health in the Red Zone, which is the counterintuitive piece our research says makes the trade stronger, not weaker. All three lining up at once is what we look for now.
Michael Salvatore: Mike, one last thing.
You’ve said we’re always developing our software here. When someone becomes a TradeSmith member, they’re not just getting the software as it exists today – they get every advancement that comes after for as long as they’re a member.
What we’ve talked about is a perfect example. But I understand you’re now thinking about bringing AI into seasonality. Tell us a little about that.
Mike Carr: Seasonality has been well-defined since the 1870s. An economist named William Stanley Jevons first wrote about it and applied math to it back in 1875, and that same mathematical technique is still how seasonality is calculated today. So we’re 150 years into doing it essentially one way.
Obviously, we do it much faster now, and we can slice the data in more ways. But as we’ve seen – adding Short-Term Health improves results, adding momentum improves results – we think there has to be a better way to calculate seasonality itself.
Right now, we’re working through different statistical techniques to establish a baseline. Then we’re going to add AI and see if we can find an AI-driven way to detect seasonality.
It’s a real challenge, because you don’t want the AI just identifying random patterns that don’t mean anything. So the hard part is training it correctly. We’re using our own numerical-data AI tools for this, not a general chatbot.
We’re setting up the experiments now, and we hope to have results pointing us in the right direction soon. And once we’re happy with the results, we’ll start thinking about adding it to the Seasonality software.
Michael Salvatore: Something to look forward to. Mike, thank you for joining us. Always a pleasure.
Mike Carr: Thank you, Michael.
Test Drive Our Seasonality Software Today
You can try out Mike’s software on the stocks you own with this free, limited-time trial version.
We’re making it available ahead of our Breakthrough 2026 event. It’s all about the seasonal patterns you need to be aware of in this critical year.
That’s why we’ve made a version of our Seasonality software available for you to explore now.
We’ve unlocked access so you can see the seasonal “green days” for thousands of stocks ahead of our Breakthrough 2026 event with TradeSmith CEO Keith Kaplan.
It kicks off Thursday, July 16, at 10 a.m. ET. And it’s urgent that you attend.
Keith will walk you through how we uncovered these patterns, why they persist even in chaotic markets, and how you can use them to guide real-world trading decisions.
More important, he’ll be also getting into detail about the fast-approaching seasonality patterns you need to be aware of.
Knowing when the windows are opening and closing likely matters more to your wealth than any single decision you’ve made.
The first date you’ll want to circle on your calendar is July 16. If seasonality patterns hold this year, it could open up a lucrative trading opportunity in one of the market’s hottest AI stocks.
To building wealth beyond measure,

Michael Salvatore
Editor, TradeSmith Daily