A Turning Point for Stocks Is Just 8 Days Away
Listen to the audio version of this article (generated by AI).
In This Digest:
- Why July 24 marks a historical turning point for stocks
- Our Signals software is eyeing this nuclear energy stock for a quick move higher
- A key risk-off sector warning that should have you checking your portfolio
July 24 marks a turning point for stocks – here’s how to prepare…
This morning at TradeSmith, we aired our Breakthrough 2026 event with Keith Kaplan.
This event was all about our Seasonality software. Regular readers know this tool works by scanning decades of a stock or index’s price history to find calendar windows where it has reliably risen or fallen, year after year.
Right now, a critical pattern is set to shift in the world’s biggest stock market.
Seasonality is flagging the S&P 500 ETF (SPY) in the middle of one of its greenest windows of the year:
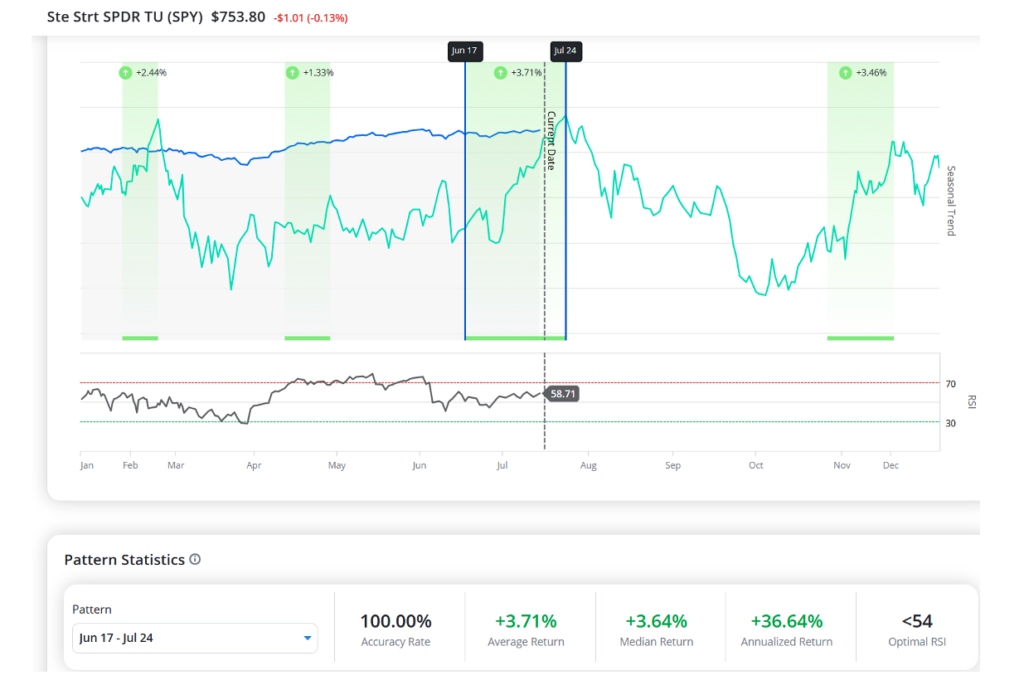
Our software shows the S&P 500 has historically climbed from June 17 to July 24 for every one of the past 15 years. And the average gain across those years is 3.7%.
That’s both a consistent and strong return for such a relatively short period. That’s why the software treats it as one of the year’s reliable “green-day” stretches.
But every green window ends. And this one ends on July 24.
After that, returns are a lot less consistent. From July 24 to the seasonal trough on Oct. 4, stocks have been higher just a little over half the time – and for an average loss of 1% when factoring in all winning and losing years:
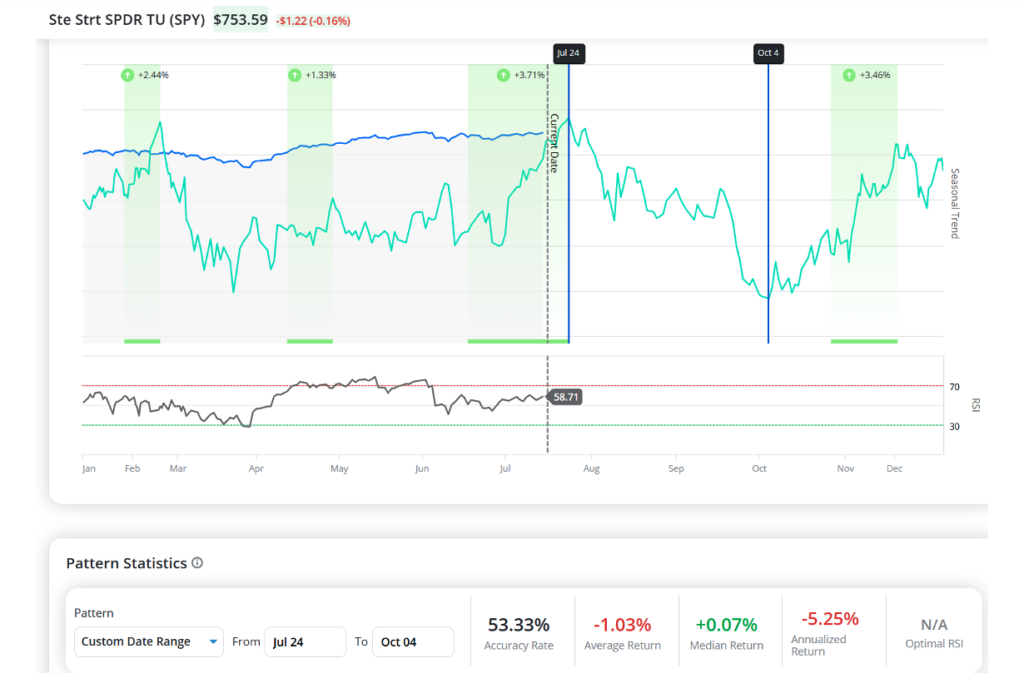
That means that we’re approaching one of the best historical periods to sell stocks for the past 15 years.
There’s a second, older pattern working against the market at the same time…
The four-year presidential cycle.
Stocks have historically struggled in the midterm year of a presidential term. The S&P 500 fell 18.1% in 2022 (Biden’s midterm election year) and 4.4% in 2018 (Trump’s first-term midterm election year).
2026 is a midterm election year, too.
Layer that on top of the July seasonal window closing right as Tesla, Amazon, Apple, and Microsoft report earnings into sky-high expectations…
Plus a year that’s already seen one of the worst losing streaks and fastest rebounds we’ve seen since 2020…
And it becomes crystal clear that you need a plan for the months ahead.
That’s why, at the event, Keith also unveiled a model portfolio built on Seasonality’s “green day” signals across 5,000 stocks.
In backtesting, this strategy turned every $10,000 into $85,700, beating the S&P 500 by an average of 99%.
If you missed it live, I highly encourage you to watch the replay. You’ll learn more about the seasonal pattern set to end on July 24 and what Keith thinks you should do to prepare now.
Get the full story right here.
Signals is bullish on this under-the-radar nuclear energy stock…
Signals is TradeSmith’s AI-powered trading system. It scans 2,467 stocks each morning and runs millions of calculations per stock to find rare, recurring combinations of factors that have historically preceded a move.
We call these “signals” because they alert us to upcoming moves.
One signal that caught my eye yesterday was on nuclear energy stock Talen Energy (TLN).
Talen Energy is a major U.S. power producer based in Houston. It operates nuclear, natural gas, coal, and oil power infrastructure and sells the electricity it generates.
The Signal that Talen tripped – one we call a Sprint signal – fires under a precise set of conditions:
- The lows and highs of the day the signal fired (its range) were above the previous day’s range
- It’s the widest range over the past six trading days
- And the stock is above its 20-day moving average.
That’s the kind of signal that’s hard to eyeball on a chart even one time, much less identify it the 33 times it’s happened over the past decade.
But our Signals software makes it easy to flag and trade these signals with the statistics to back it up.
Historically, this signal has resulted in a gain in the stock 90.1% of the time. The average winning gain was 5.5% over about 9 days. And the average loss was less, at 4.6%.
TLN has been choppy lately, forming a series of higher lows over the past several months:
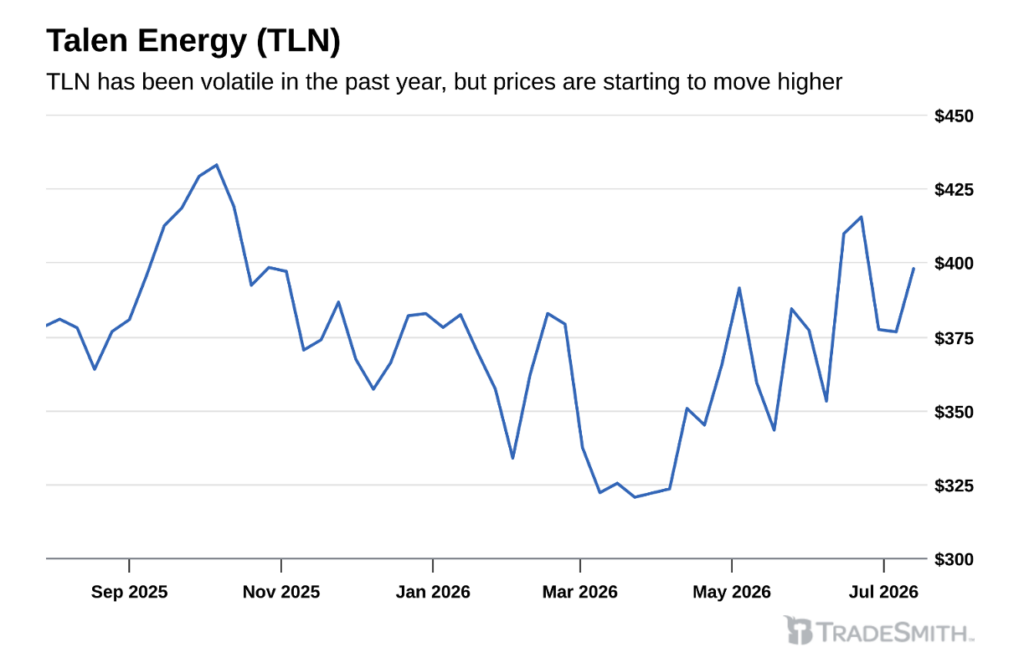
f you’re interested in short-term exposure to the nuclear power trend, this signal might prove a valuable trade to make. Just make sure to exit the trade after a 6% gain or after 21 trading days, whichever comes first.
This risk-on sector just flashed Red, and it’s a warning sign to check your portfolio…
My daily research ritual starts with TradeSmith’s Market Sector Health dashboard. At a glance, it tells me which of the major market sectors are starting or continuing strong uptrends… or breaking down.
Sometimes, when key sectors break down, it can act as a warning sign for some of the most popular stocks in investor portfolios.
Take the SPDR Consumer Discretionary ETF (XLY), which just flashed Red on our Short-Term Health indicator.
Short-Term Health is TradeSmith’s most sensitive trend indicator. It compares a stock’s or index’s recent price action to its normal trading range and flags momentum shifts as Green (buy), Yellow (caution), or Red (sell).
The XLY ETF of consumer stocks represents the biggest “wants” companies in the market. They’re the things consumers don’t need but like to have when times are good.
The top five holdings of XLY illustrate this perfectly. E-commerce and cloud services titan Amazon (AMZN) makes up 22.2% of the ETF holdings. Following that is electric vehicle, solar, and robotics maker Tesla (TSLA), at 19.6%.
DIY home improvement retailer Home Depot (HD), fast-food mega-franchise McDonald’s (MCD), and retail goods chain TJX Companies (TJX) trail with allocations between 3.9% and 5.8%.
All of these companies are where consumers spend when their needs are covered. All else equal, they do well when the economy does well.
So the fact that these companies are shifting risk-off is important. Here’s the chart from our sector dashboard:
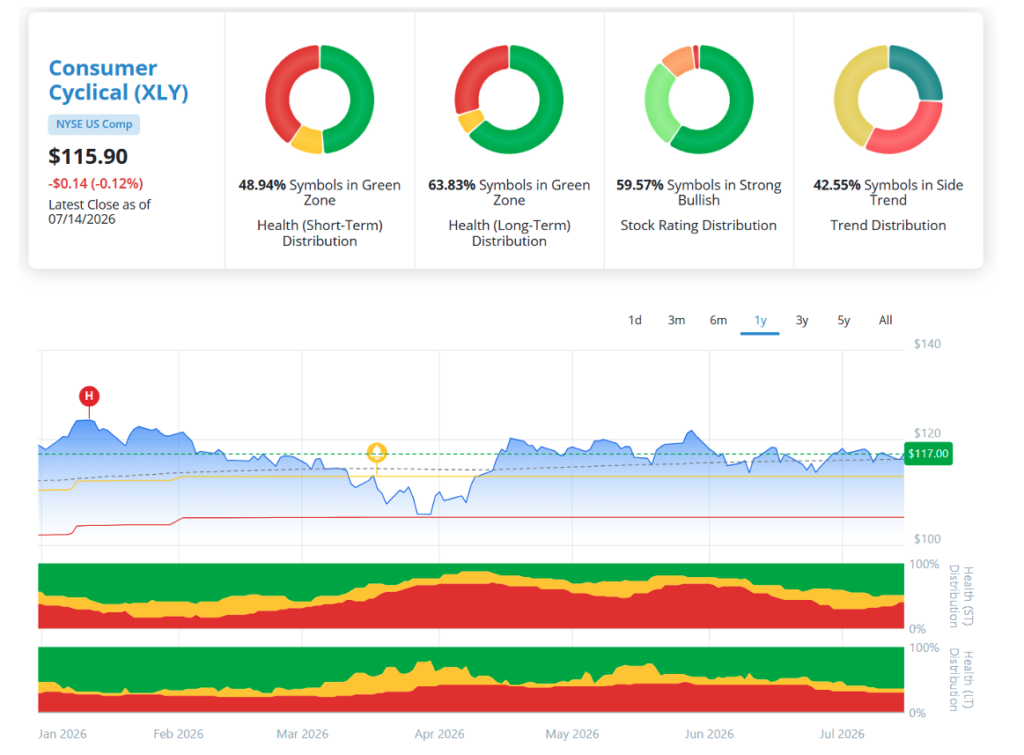
XLY shifted into the Short-Term Health Red Zone on July 14. Along with it, less than half of the companies in the ETF are in the Short-Term Health Green Zone – a buy signal.
And some of the recent Health shifts are notable:
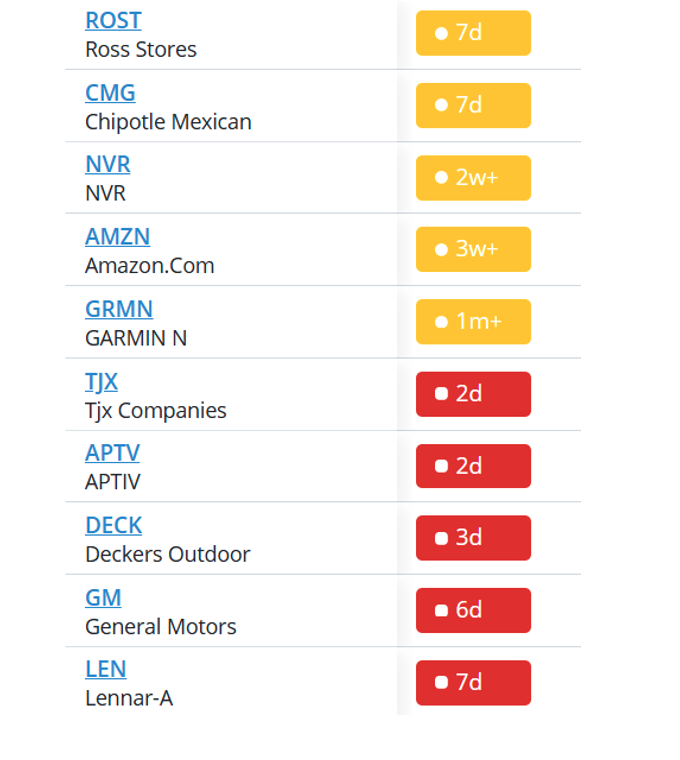
In the consumer retail space, Ross Stores (ROST), Amazon (AMZN), Chipotle (CMG) TJX Companies (TJX), and Deckers Outdoor (DECK) have all shifted Yellow or Red within the past few weeks.
Automotive stocks like General Motors (GM) and Aptiv (APTV) both shifted Red in the last week.
And homebuilders NVR (NVR) and Lennar (LEN) have both recently shifted, too.
If you own any of these stocks or similar ones, Short-Term Health says it’s time to consider taking profits… or even outright sell them if you’re holding them over a shorter timeframe.
And keep an eye on the Consumer Discretionary sector as a whole. It’s a key barometer for investor risk appetite.
To building wealth beyond measure,

Michael Salvatore
Editor, TradeSmith Daily