A Rough Week Is Not the Same as a Broken Trend
Listen to the audio version of this article (generated by AI).
If you’ve been anywhere near the financial news these past few days, you may have felt your stomach churn.
Oil is spiking, tech stocks are tumbling, and there’s fresh talk that the AI boom might be a bubble about to burst.
If you’re feeling a little rattled, you’re not alone – and you’re not wrong to pay attention. But it’s important to stay rational when the news takes a turn for the worse like this.
Today, I’ll walk you through what happened this week to worry investors. Then we’ll look at what the data – not the headlines – says about where we go from here.
The trouble started nearly 6,000 miles from Wall Street, in the Red Sea.
Oil Up, Tech Stocks Down
Yesterday, two Saudi oil tankers came under fire from Houthi militiamen, the Iran-backed group that controls much of Yemen.
This is a massive vulnerability for one of the largest oil-exporting nations, Saudi Arabia. The Saudis route oil through the Red Sea to avoid the Strait of Hormuz – the passage Iran has already been menacing. Close the Bab el-Mandeb, and that backdoor slams shut, too.
By yesterday’s close, Brent crude, the international benchmark, crested $100 a barrel. And U.S. oil prices hit the $90-per-barrel mark.
Rising oil prices push up the cost of everything from gasoline to groceries. They also raise the odds that the Fed hikes interest rates at its next meeting – which would raise the cost of borrowing across the economy.
That’s where this story collides with the other news troubling investors: Google’s whopping bill for its AI data center buildout.
Google’s $200 Billion Bet
Google’s capital spending – the money it lays out on data centers and AI chips – doubled to nearly $45 billion in a single quarter. And the company said full-year spending could reach $205 billion, with more to come.
All that spending has a cost. For the quarter, Google burned through nearly $6 billion more cash than it took in. And when rates are rising, the market turns cold on companies spending fortunes now for profits that may be years away.
Google’s share price dropped sharply on the news. It’s down about 9% this week alone.
And it’s not just Google that’s taken a hit. Yesterday, the Magnificent Seven tech stocks lost nearly $800 billion in market value – the worst wipeout for the group since the post-Liberation Day “tariff tantrum” in April 2025.
There are all sorts of stories and opinions swirling around about what’s next for Iran, the price of oil, and the AI buildout in the press and on social media.
But we’ll let the data do the talking. Let’s start with what the calendar says.
Tech’s Seasonally Bullish Window Just Closed
The Nasdaq-100 – the tech-heavy index at the center of this week’s selling – just left a stretch of the year that’s historically been kind to it.
Here’s a seasonality chart from the TradeSmith Finance platform for the Invesco QQQ (QQQ), the fund that tracks that index.
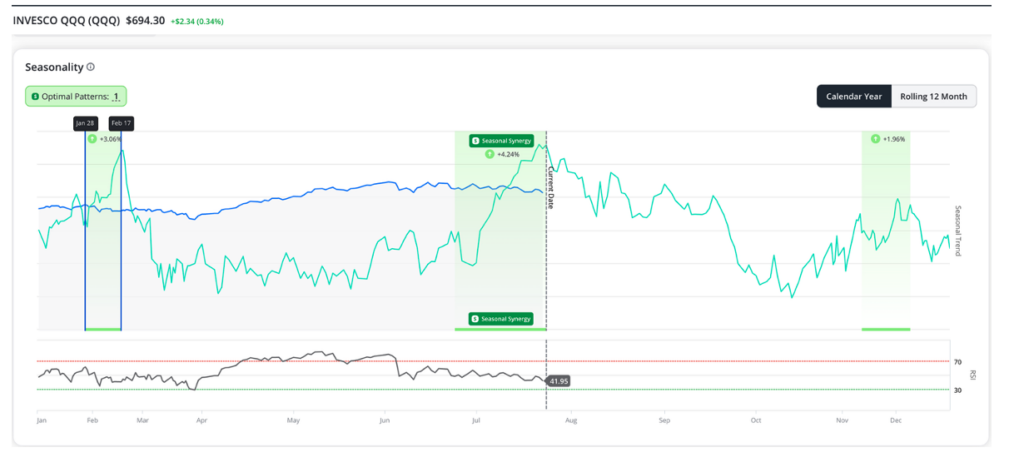
See the green shaded area in the middle?
Going back 15 years, QQQ has risen 93% of the time during that window – a stretch that runs from June 24 through July 24. Today, in other words.
Why back 15 years? We’ve found that 15 years captures the market roughly as it works now. If you go back further – to before index funds, ultra-low trading fees, and computerized trading – you muddy the picture.
The green line to the right shows that the rest of the year is, on average, less kind. The weeks just ahead have historically been softer before a brief bullish window returns from Nov. 12 to Dec. 9.
Does this pattern have to repeat this year? No. There will be years the signal misses. But when something has held 93% of the time, it’s worth paying attention to.
It’s not a reason to panic. It’s roughly what this time of year has tended to look like in recent years.
The Market’s Vital Signs Are Still Healthy
Seasonality tells you what tends to happen this time of year. It doesn’t tell you what’s happening right now, today. For that, I turn to another of our most popular tools, Short-Term Health.
It looks at stocks’ normal trading behavior – their usual rhythms of ups and downs. Then it watches for moves that break the pattern.
As long as a stock trades within its normal range, the trend is healthy. We call that a Green Zone. When it starts moving in a way that’s out of character, it moves into a Red Zone. Yellow sits in between – a caution flag.
Here’s what it shows after this week.
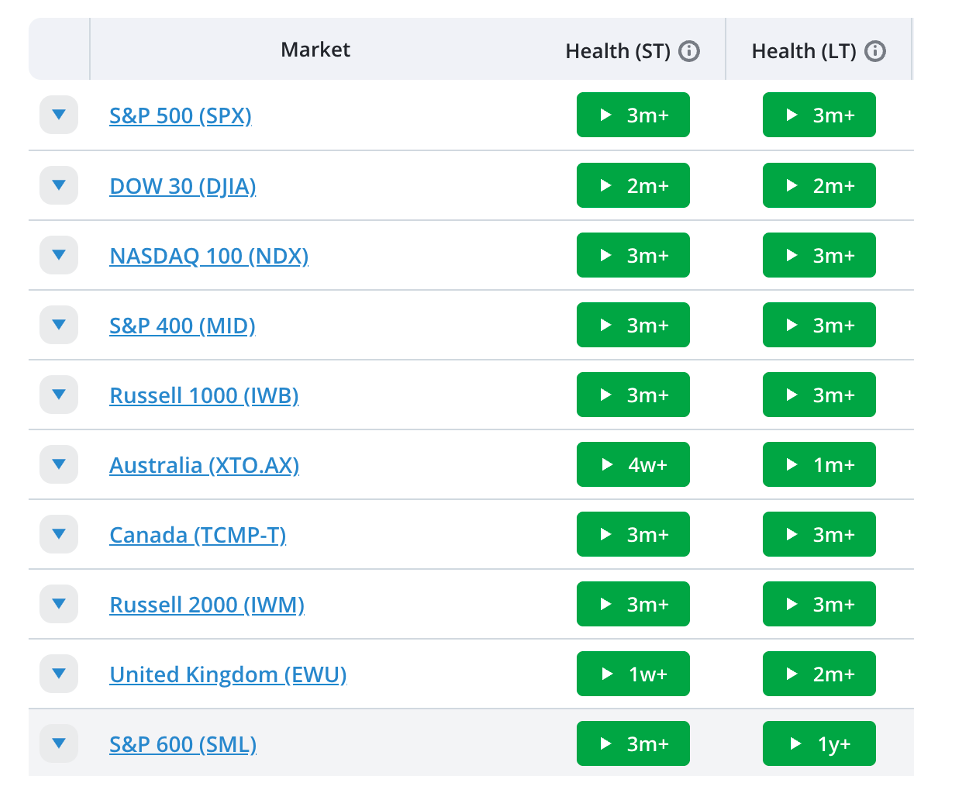
Every major U.S. index we track – the S&P 500, the Nasdaq-100, the Dow, and the small-cap Russell 2000 – is still in a Green Zone. So are the international markets we track.
For all the fear out there, our most sensitive signal hasn’t seen a single one of them break its trend. A rough week, it turns out, is not the same thing as a broken trend.
What the Market’s Mood Tells Us
We don’t just track the market’s regular schedule and its vital signs. We also track its mood, with a tool we call Fear & Greed.
It pulls together everything, from how investors are treating risky bonds to how jumpy options traders are, to whether they’re fleeing stocks for the safety of Treasury bonds, and boils it down to a single number from 0 to 100. Low means fear. High means greed.
After a week like this, you might expect it to be flashing fear. It isn’t. It’s sitting right around 55 – smack in the middle, neither fearful nor greedy.
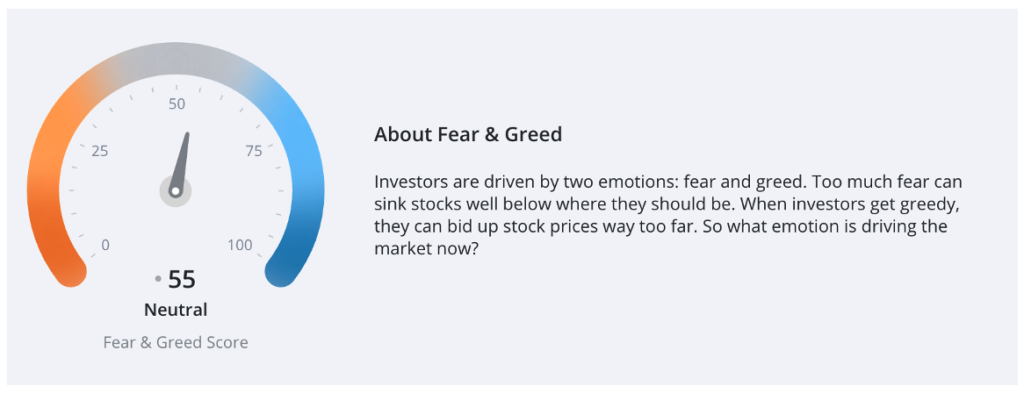
And by this gauge’s own standards, that’s remarkably ordinary. Over the past five years it has swung from near zero, in the depths of the 2022 selloff, to the low 90s at the height of the 2023 rally.
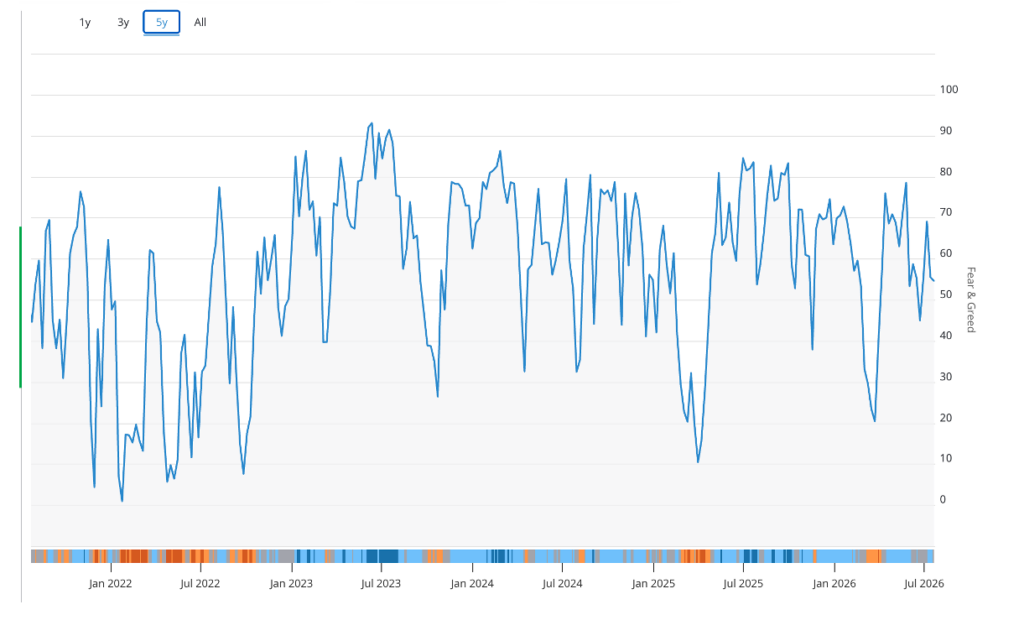
This cuts both ways.
On one hand, it’s reassuring. For all the scary headlines, investors as a group haven’t panicked. That fits everything else the data is telling us – this looks like an ordinary wobble, scary but not broken.
On the other hand, in the absence of a real panic, it’s easy to get lulled into neglecting risk. Which brings me to the most important thing I can tell you today.
The Best Time to Prepare Is Now
For now, our signals show a market that’s still healthy. The trends are intact, and the weakness we’re seeing is roughly what this time of year tends to bring.
But no matter what you think is coming next, now is a great time to shore up your portfolio. Most people only think about risk once the market is already falling – the worst possible moment to make a clear-headed decision. But the time to prepare for a storm is while the skies are still calm and you can think straight.
So if this week rattled you, put that feeling to work. Know your exit for every position you own before you need it. Set your stops. Make sure no single holding can do real damage if it turns against you.
None of this requires predicting the price of oil, the Fed’s next move, or where the AI trade goes from here. It just means deciding, in advance, how you’ll handle trouble before it arrives.
That’s the advantage of following the data instead of the headlines. When the trend is healthy, you stay in and let your winners run. And the day our signals turn – on a stock, a sector, or the whole market – you won’t have to guess, and you won’t have to panic. You’ll already know exactly what to do.
That’s how you stay in the game long enough to win it.
All the best,
Keith Kaplan
CEO, TradeSmith