Chipmakers Aren’t in a “Bear Market”
Listen to the audio version of this article (generated by AI).
In This Digest:
- Why the semiconductor slide is nothing to sweat for now
- A buy-the-dip chipmaker for your shopping list
- Is it time to get back into gold?
This year’s hottest trade has taken it on the chin…
If you bought semiconductor stocks at the start of the year, you’re probably feeling pretty good.
With Big Tech companies in the U.S. set to spend $700 billion on AI infrastructure this year, investors have scrambled to buy up shares of as many related companies as possible.
And the VanEck Semiconductor ETF (SMH), which holds a group of chipmaker stocks, is up 47%.
But if you bought in more recently, you’re feeling some pain. Since it peaked on June 22, SMH is down almost 22% – leading many in both the mainstream financial media and social media like X to say the sector is in a bear market.
It’s no fun going through a stretch of losses like that. And there may be more losses before the trend turns positive again.
But according to TradeSmith data, no matter when you bought in, now is not the time to sell.
In fact, a 22% dip – despite being within the blanket range for a “bear market” – is actually a typical downturn for SMH.
Today, we’ll show you why. We’ll also look at the one beaten-down chipmaker our system likes right now.
Every stock or index has its “wiggle room”…
When you log on to TradeSmith Finance and pull up the ticker SMH, you’ll see that it has a Volatility Quotient (VQ) of 28.6%.
That means SMH’s price typically swings up or down by about 28.6% over the course of a normal year.
Think of the VQ as each investment’s personal wiggle room. A calm, steady stock has a low VQ. Think Berkshire Hathaway (BRK.B) with its VQ of 11.3%, the lowest of any stock in the S&P 500.
A jumpy one has a high VQ. Cryptocurrency exchange Coinbase (COIN), for example, has one of the highest VQs in the S&P at 60.7%.
Whether it’s high or low, VQ tells you how much movement is normal noise – and how much is a real warning sign worth acting on.
That matters here because it turns a scary-looking drop into something you can measure.
Going by its VQ, SMH would have to fall another 5.1% to about $493 a share before our system recommends selling it. Longtime TradeSmith readers would know that as a Long-Term Health Red Zone – the red line on the chart below:
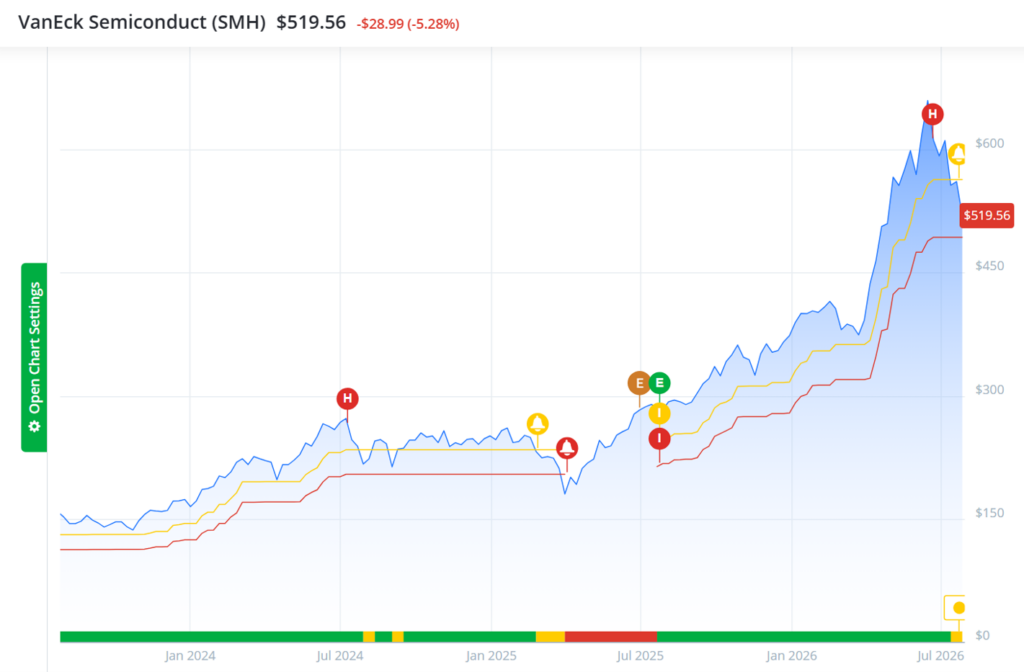
Now, that is close. So if you’re subscribed to TradeSmith, you should keep a close eye on SMH’s health status. But as of right now, the selloff is more of a buying opportunity than a reason to panic sell.
SMH has also been in a Short-Term Health Green Zone since April. And the recent dip hasn’t been enough to send it into a Yellow Zone (meaning caution) or a Red Zone (meaning its short-term bullish trend has broken down).
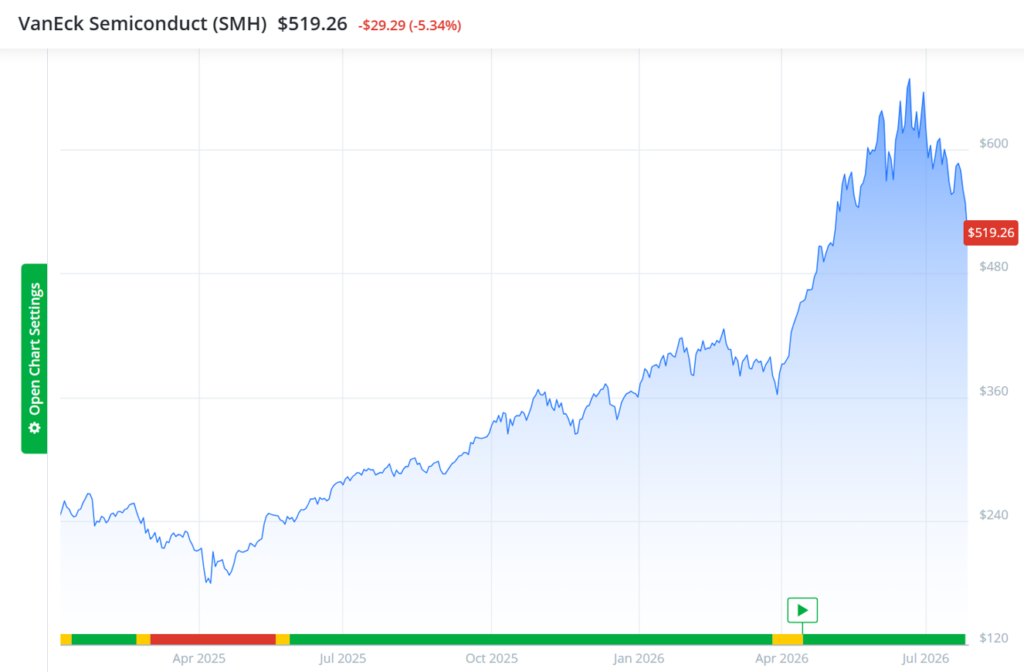
Sure, there are some scary headlines in the press about the AI infrastructure trade tapping out. It just isn’t showing up in our data. And we recommend staying bullish until it does.
A few individual chipmakers look like good buys again, too.
Top of the list is Micron (MU)…
If you’ve been anywhere near the financial news this year, you’ll have heard of it.
Micron makes memory chips – and memory is the one part the AI boom can’t get enough of. Every AI chip needs stacks of a special high-speed memory called HBM to feed data to the processor fast enough.
Micron is one of only three companies in the world that makes it, and its entire supply for this year sold out under contract.
That pricing power turned a business once known for boom-and-bust cycles into one of the year’s standout performers – its market value even crossed $1 trillion for the first time.
And it rose as much as 285% this year before giving up almost a third of those gains.
Micron’s one of the top-rated opportunities according to our Quantum Score. As regular readers will know, the Quantum Score ranks stocks by their fundamentals (revenues, profits, debt, etc.) then looks at signs of unusually large money flows:
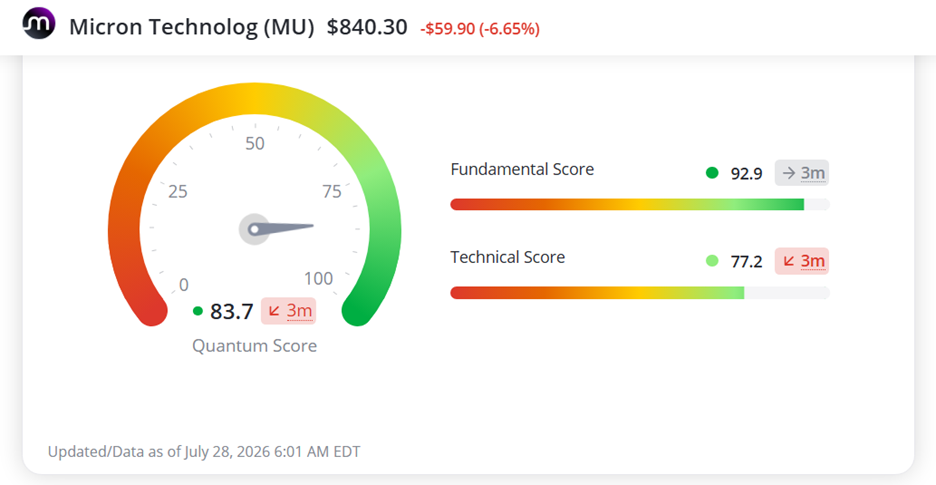
Micron’s Fundamental Score has stayed steady at 92.9, meaning it’s an elite business. And it has a Technical Score of 77.2 – among the highest in the sector – meaning it still has a lot of buying momentum behind it.
Gold’s most reliable signal this year just fired for a fourth time…
Our master trader Jeff Clark just pointed out a little-known buy signal for the gold sector.
The Bullish Percent Index (BPI) is a tool that measures the percentage of stocks in any given index trading in a bullish technical pattern.
According to Jeff, above 80% and the group is overbought. Below 30% and it’s oversold.
Three times this year, the Gold Miners BPI – BPGDM – has dropped below that 30% floor, then turned back up.
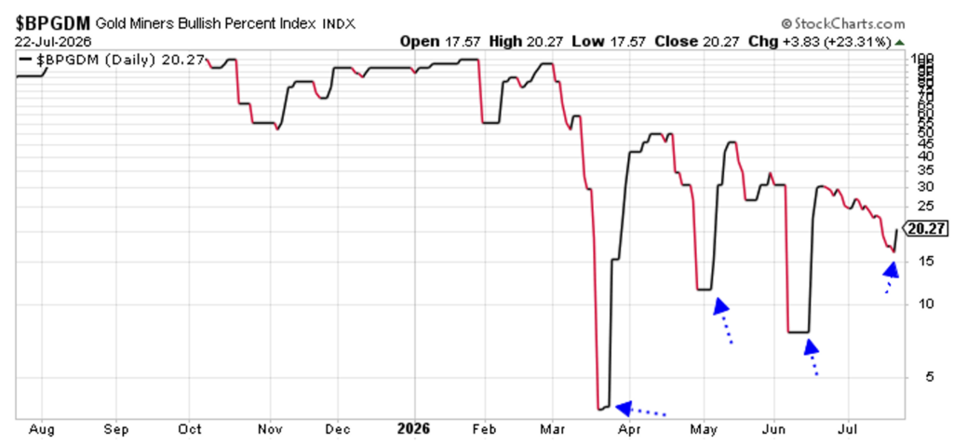
All three times, gold mining stocks responded fast. The Gold Bugs Index (HUI) – a benchmark of major gold miners – gained between 13% and 20% in two weeks or less, every time.
On July 24, the BPGDM flashed that same reversal a fourth time.
Three-for-three isn’t a promise the fourth signal repeats. But it’s a strong enough track record to put gold miners on your watchlist this week.
To building wealth beyond measure,
Michael Salvatore
Editor, TradeSmith Daily
Disclosures: At the time of this writing, Michael Salvatore held shares of BRK.B.