Get The Whole Earnings Story With These TradeSmith Tools
Second-quarter earnings reporting season is off to a great start: So far, S&P 500 companies are reporting year-over-year earnings growth of 38%. That’s excellent news already – and there are still plenty of reports to come before this earnings season ends.
Ah, but the devil, as always, is in the details… and that’s where we see that a few earnings season shenanigans can mislead you.
For example, let’s take a look at Google’s parent company, Alphabet (GOOGL).
Last week, the company reported a net income of $112.1 billion and an earnings per share (EPS) of $9.11. That was almost four times the $28.2 billion Alphabet earned this time last year.
But $90 billion, or 75%, of that $112 billion of net income came from “paper gains.” More specifically, the reported EPS number was inflated by non-cash gains from the company’s stakes in SpaceX (SPCX) and Anthropic.
Now, don’t get me wrong – this financial reporting is perfectly legit, according to the usual accounting standards.
But still, when you exclude those paper profits, Alphabet posted just $14 billion of net income… or an EPS of $2.85. That’s a far less impressive result than the headline EPS result of $9.11 would lead you to believe.
You have to dig deeper into the financial fine print to figure these things out. But fortunately, you don’t need to be a detective to do it: With the tools on your TradeSmith Finance platform, it takes just a few clicks.
Here’s how…
Find The Facts with the Financials Tab!
Simply log into your TradeSmith Finance platform, then use the search bar at the top right to find and select any ticker you want to research – like GOOGL, to continue our example.
Once you’ve arrived on your chosen stock’s Asset Details page, just select the Financials tab from the menu to view the most recent company Fundamentals on an Annual or Quarterly basis:
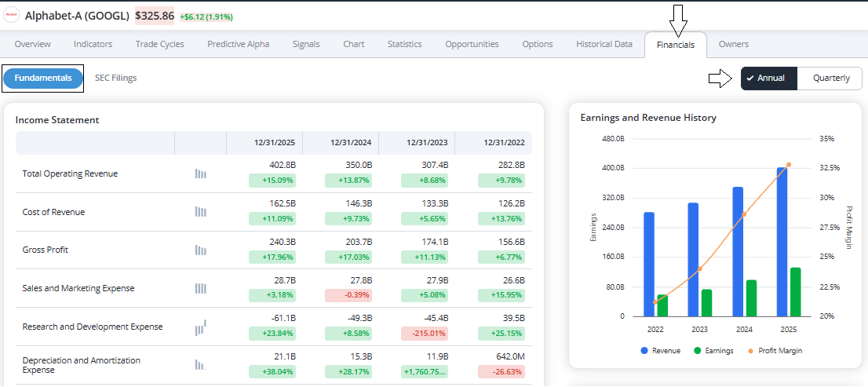
This page is your one-stop shop for financial data on each stock you research. In addition to the Income Statement shown at the left, this tab also includes bar graphs showing more key data, including Earnings and Revenue History as well as actual versus estimated EPS metrics.
You’ll also find the latest Balance Sheet and Cash Flow data, including thumbnail bar charts that show the rise or fall in each fundamental metric, as shown below:
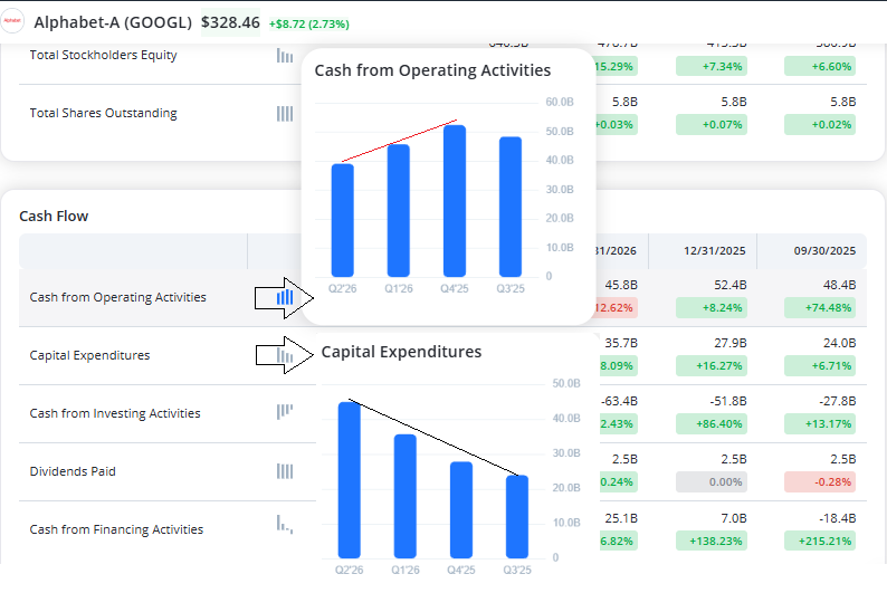
And as you can see, Alphabet’s Cash from Operations has dropped steadily in recent quarters. Just click on the highlighted icon to view the larger bar charts shown above.
Even worse, Alphabet had a negative free cash flow (FCF) of $5.8 billion just in the last quarter alone. As a reminder, FCF is simply Operating Cash minus Capital Expenditures.
And that’s a big reason why, despite great headline results, Alphabet shares tanked 7.5% last week.
The culprit for the flagging financials is Alphabet’s rapidly rising capital expenditures (or CapEx), shown in our data below the company’s operating cash flow data.
In fact, the company said it expects to spend $200 billion in CapEx this year alone. By comparison, the company’s total free cash flow over the last 12 months was only $53.3 billion!
No wonder investors are nervous about so much spending eating into Alphabet’s cash flow machine.
Now, I don’t mean to pick on Alphabet here. It’s a quality company with a wide moat around its business, and a well-established track record for growth. But its recent results can be a bit misleading.
And Alphabet’s not alone in this: Other leading “Magnificent 7” mega-cap stocks like Microsoft (MSFT), Nvidia (NVDA), Tesla (TSLA), and Meta Platforms (META) are reporting similar one-time “paper gains.”
That’s why for my money, when it comes to evaluating a stock, the best metric to use is free cash flow, not earnings per share.
It’s just too easy these days for creative accountants to manipulate earnings. Which is why free cash flow – the actual cash earned by a business – is a much better and more revealing number to use.
And the best way to find potential winning stocks is by Free Cash Flow yield. That is, a company’s free cash flow divided by its enterprise value (market capitalization + debt).
Companies with high free cash flow yields deliver superior risk adjusted returns, compared with stocks selected by the more popular Price to Earnings (P/E) ratio. In fact, S&P 500 stocks with the highest free cash flow yields outperform stocks with low P/E ratios by more than 4% historically – and with less volatility, too!
So, to help avoid being misled by other earnings inflated by “paper gains” – and zero in on stocks with superior free cash flow yields in the process – we can turn to our trusty TradeSmith Screener.
Here’s how to build your own financial detective in no time flat…
Sleuth Out Superior FCF Yields with an Earnings Season Screener
First, log in into TradeSmith Finance if you haven’t already. Then, click on Invest from the main menu, then select the Screener tab to find my favorite TradeSmith tool.
Now, let’s screen for S&P 500 stocks with the highest free cash flow yields by adding a few simple filters. Just click the blue +Add Filter button to add anything you need.
Let’s start with healthy stocks according to our TradeSmith Health Indicators, by filtering for Health (Short-Term) and Health (Long-Term) – we’ll set our filter to only show stocks in the Green and Yellow Zones.
Next, we’ll add the Markets filter and select S&P 500 (SPX) to narrow our search to only those stocks in the benchmark index.
Finally, we’ll find the Free Cash Flow Yieldfilter under “Valuation & Fundamental Metrics” in the +Add Filter menu. Click to add it to our screener and set it to only show stocks with an FCF yield of more than 6%.
That’s all there is to it. Your final screener should look like this:
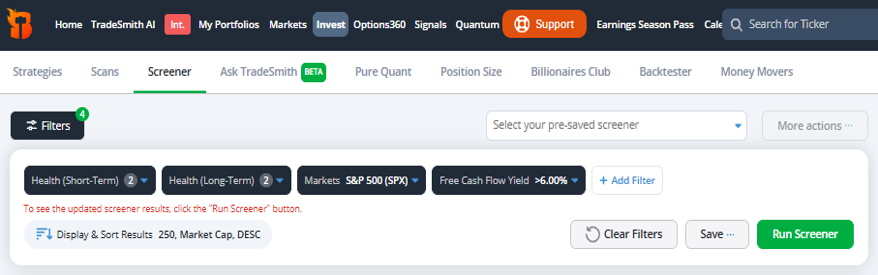
The average free cash flow yield for the S&P 500’s component stocks is just over 3%. So, for this screener we’re zeroing in on stocks with at least twice that average yield.
When I ran this screen yesterday, I came up with 58 results. All are healthy stocks with higher-than-average free cash flow yields.
Those with double-digit yields are shown below sorted by free cash flow yield, highest at top:

As you can see, many of these stocks also pay generous dividend yields – another great metric to look for in volatile markets!
Mike Burnick’s Bottom Line: Earnings reporting season can be tricky. That’s because the reported earnings numbers that make the headlines can be less than meets the eye.
That’s why you should always dig deeper, using the Financials tab on your TradeSmith Finance platform. By reviewing fundamentals like free cash flow yield, you’ll have a far better time judging a stock’s true cash earnings potential.
Good investing,
Mike Burnick
Senior Analyst, TradeSmith
P.S. Earnings season can be a great time to research potential investments – and tools like our TradeSmith Screener can help you identify exactly which stocks you want to pick up.
Still, sometimes it can help to have an expert on your side, to point you in the right direction.
And when it comes to experts, there are few people I trust as much as my fellow TradeSmith Analyst Lucas Downey – editor of the TradeSmith Investment Report. Lucas is one of the most brilliant minds on Team TradeSmith, and a genius when it comes to identifying the stocks best positioned to benefit from major market themes.
It’s what led to Lucas’s subscribers achieving gains of 133.95% on Super Micro Computers (SMCI) or 78.20% on United Therapeutics (UTHR).
Right now, Lucas is dedicated to his research on the ongoing AI boom… and all the opportunities across the market triggered by that same boom.
If you aren’t already reading Lucas’s work in the TradeSmith Investment Report, you’ll want to fix that: Each week, Lucas shares his institutional-grade research and market analysis with his readers, along with trade opportunities to capitalize on the latest trends he’s identified.
Click here to learn more about the TradeSmith Investment Report.