How Healthy Is the Stock Market, Really? TradeSmith Indicators Can Tell You
Holy Volatility, Batman!
The stock market has been on an extremely wild ride recently.
After the Nasdaq 100 Index, home to most leading technology stocks, took a nosedive of more than 10% in 20 trading days, it rebounded even faster – up 10% in just five days!
Chalk it up to a highly concentrated, whipsaw stock market environment these days.
That’s why more than ever you need proven market health and sentiment indicators on your side to help you safely navigate these volatile twists and turns in markets.
And our TradeSmith development team delivers.
Today, I’ll walk you through the newly enhanced indicators so you can get a better feel for what’s really going on in the market.
A Deeper Look into Market “Health”
Fear and greed are the two “emotions” that charge major market activity.
When investors are fearful, they begin selling. When they’re greedy, buying comes in full force.
And recently, the TradeSmith team has enhanced our proprietary TradeSmith Fear & Greed Indicator, which is an integral part of our Trade360 and Options360 Market Outlook Indicators.
I’m sure you’ve noticed the updated look of our Options360 page. And right at the top of the page sits our all-new Options Market Indicators.
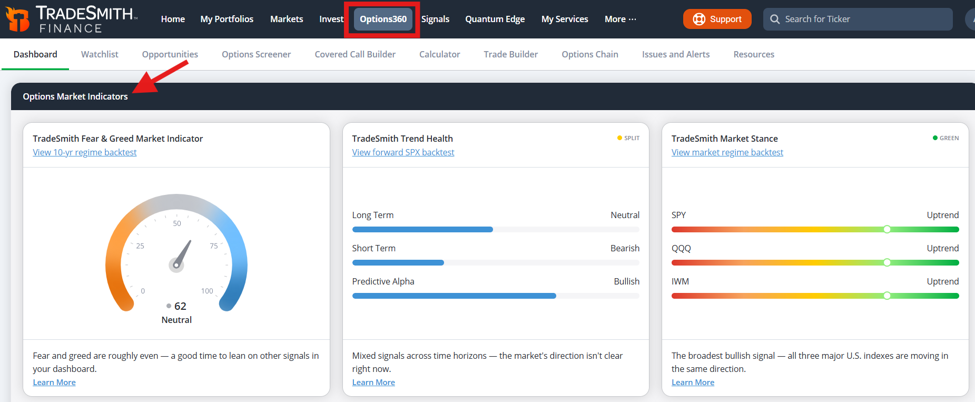
These new metrics are a valuable guide to the overall market trend and health for every investor.
And for option traders, these Market Indicators deliver key insights to make you a more successful trader by showing you how to better position your option trades.
Subscribers can easily access these new indicators. Simply login in and click on Options360 from the main menu bar. This should land you on the Dashboard tab. (Please Note: If you don’t see this – and would like to – simply contact our Customer Care team at 888-623-0858 to learn more.)
You’ll see the Options Market Indicators at the top of the page. Let’s cover each section from left to right starting with our updated…
Fear & Greed Market Indicator
The old Fear & Greed Indicator was based on a combination of factors including the VIX (the “fear” index), option put/call ratios, and other sentiment indicators. But we felt it didn’t deliver the precision we wanted for a key market health measure.
So, we went back to the drawing board and built a new Fear & Greed Indicator based entirely on our proprietary TradeSmith indicators and data.
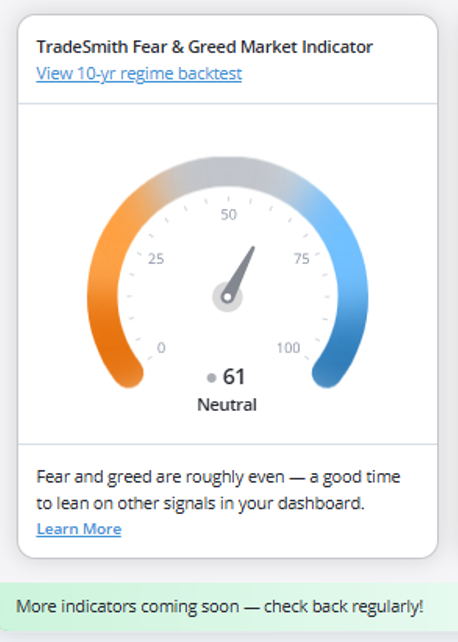
For those who have Ideas by TradeSmith, Trade360, and TradeSmith Platinum, you can also find the new and improved Fear & Greed Indicator on the Market Outlook page of our website.
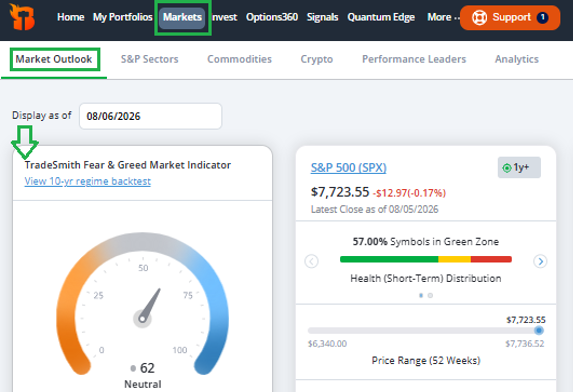
Here’s how the score is figured…
Each stock in our database is scored on three factors:
- How far a stock drops from its 63-day high…
- How volatile it is over the past 20 days…
- And whether volume has spiked unusually.
The final reading reflects the percentage of all stocks that fall into one of five sentiment groups:
- Extreme Fear: Widespread panic. Very low readings can lead to stronger upside market moves. Score is 0-19.
- Fear: Fear but not full panic. Readings in this range tend to produce positive returns. Score is 20-29.
- Neutral: Balance between fear and greed. No real edge, but which for individual signals. Score is 30-69.
- Greed: Elevated greed breadth, which means a more cautious stance may be warranted. Score is 70-79.
- Extreme Greed: Widespread bullishness. High readings tend to precede weaker returns. Score is 80-100.
The current Fear & Greed reading is neutral at the moment, as you can see above. But when it drops below 20, the market has historically rebounded. And when it moves above 80, stocks can struggle.
In fact, our testing shows that Extreme Fear readings produce an 85% win rate for the S&P 500 with +6.4% average gains over 20-day. So, widespread fear can be a reliable contrarian-buy signal.
For option traders, fear has historically coincided with a contrarian-bullish edge.
So, aggressive traders may consider buying calls, while more conservative folks might consider covered calls or selling puts to collect premium income.
Extreme Greed, on the other hand, can often lead to poor results. Our testing shows that those readings produce only a 52.9% win rate, with just 0.4% average 10-day returns.
So, widespread greed is a signal to proceed with extreme caution. For option traders, this means considering reducing position sizes and buying puts for protection.
Now, let’s move on to another helpful indicator: Trend Health…
TradeSmith Trend Health
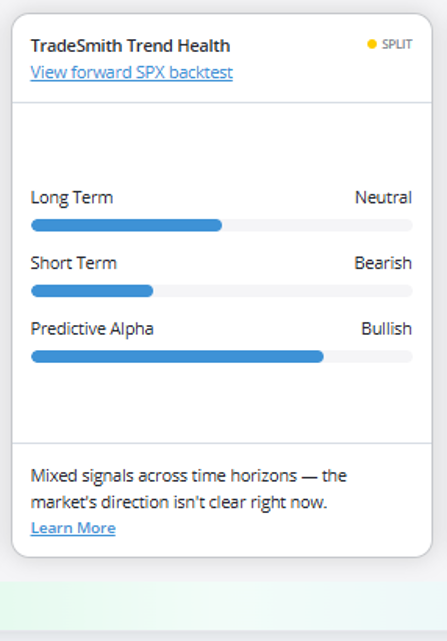
This market indicator tracks how many stocks are currently showing healthy signals across three TradeSmith indicators, which cover different time frames:
- Long-Term Health: the past several months to a year
- Short-Term Health: the past several weeks to months
- The Predictive Alpha algorithm: the next 21 trading days
A larger share of healthy stocks and bullish Predictive Alpha readings points to a stronger market uptrend. These three factors won’t always line up exactly, but they provide an important weight of the evidence approach in following the market trend.
When the indicators disagree somewhat it’s worth taking note.
For example, if Long-Term Health is Green, but Short-Term Health weakens to Yellow, that may signal a temporary market dip. And when Short-Term Health flips Green again, that can serve as a flash buy signal.
- For option traders, when a majority of these three signals are bullish, you may want to consider buying call options or bullish call spreads.
- When most are bearish, you may want to turn to put option buying to hedge for downside protection.
- And when signals are mixed, with Short-term Health and/or Predictive Alpha turning yellow or red. That may be a good time to consider selling covered call or put options for income, instead of making aggressive directional trades.
Let’s move on to our next indicator: Market Stance…
TradeSmith Market Stance
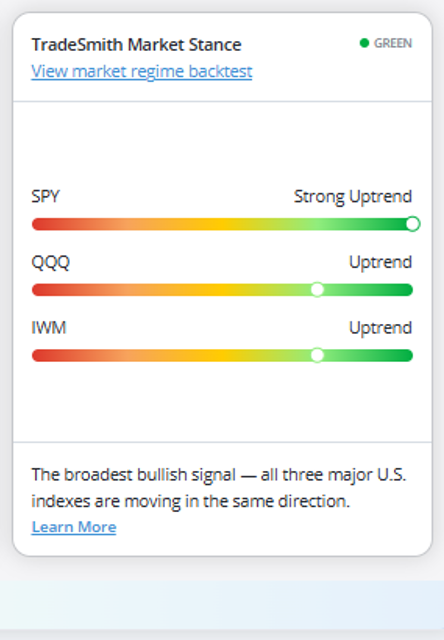
This tool tracks the Health trend for three major index tracking ETFs:
- SPY, which tracks the S&P 500 Index…
- QQQ, tracking the Nasdaq 100…
- And IWM, which tracks the Russell 2000 small-cap index.
Each index can be colored Green, Yellow, or Red based on the direction and strength of the recent price trend for each index. Combining all three can uncover clues that just one index on its own may hide.
- The overall rating is Green when all three indexes are lined up in a bullish trend…
- This indicator turns Red when all three indexes are trending bearish…
- And Yellow tells you when the index trends are diverging.
Once again, this provides valuable insights for option traders about which type of option strategy to choose.
- When the Market Stance is Green, that’s a signal to consider buying call options or bullish call spreads.
- For a Red signal, you may want to consider buying puts or bearish put spreads.
- A Yellow Stance indicates mixed conditions. A good time to consider income-producing option trades like short put spreads and covered calls.
Mike Burnick’s Bottom Line: Our new Options Market Indicators combines our popular Health Indicators (both Long- and Short-Term) with our proven Predictive Alpha AI-powered forecasts. And it combines signals from multiple markets, making it a valuable market-wide indicator, supported by detailed backtested performance data, not just a standalone metric. This provides you with real-time insight into the health and trend of the overall markets to help make you a better investor and option trader.
Good investing,
Mike Burnick
Senior Analyst, TradeSmith
P.S. While the TradeSmith Fear & Greed, Trend Health, and Market Health Indicators all can greatly help you understand the true sentiment of the market as it stands now, they can’t tell you what’s coming.
And what’s coming could be so big that TradeSmith CEO Keith Kaplan and 50-year Wall Street legend Marc Chaikin have called it “the Great Bear Market of 2026” – and they know when exactly it could hit us, down to the month and day.
And it could happen sooner than most people are ready for…
But that’s where being a part of TradeSmith gives you an edge.
Right now, Keith and Marc have the #1 step you need to take before September 1st to protect your portfolio.
Plus, they’ll show you a brand-new way to invest that could hand you lightning-fast potential gains every month, even as the overall market falls. Get the full details here for a limited time.