This Signal Says NVDA Has Room to Run
Listen to the audio version of this article (generated by AI).
In This Digest:
- Our Signals software called Nvidia’s earnings jump ahead of time
- Gold and silver miners are popping up again on our emerging trends screen
- If you missed our 30-Day Wealth Accelerator event, catch it now
Our Signals software was ahead of Nvidia’s post-earnings rally…
The AI trade bellwether reported earnings after the closing bell yesterday, beating Wall Street’s expectations.
Revenue came in at $96.2 billion, up 18% from the prior quarter and up 106% from last year. That was ahead of the $92.1 billion Wall Street was expecting.
Earnings per share hit $2.22, up more than 100% from the same quarter last year.
And investors loved what they heard.
Since yesterday’s close, NVDA has climbed about 10%, putting it near 1-month highs.
Our Signals system called the move early.
A signal study is a way to read a stock’s own history to figure out what tends to happen next. Every stock has a kind of “thumbprint” – patterns in its trading that show up again and again.
Our software scans years of that history, finds the moments that looked just like today, and asks a simple question: The last time this setup appeared, which way did the stock go, and by how much?
Not once or twice – but dozens of times, going back years. Instead of guessing, you’re leaning on what the stock has actually done every other time it looked like this.
Yesterday, a “volatility expansion” signal fired for NVDA.
That fires when a stock has been in a tight trading range, and then it suddenly expands. And it’s worth paying attention to.
Over the past 10 years, this same signal has fired 21 times, with a 76.2% accuracy rate.
The average gain across those winning trades is 7.6% against an average loss of 6.8% on the ones that didn’t work – a reward-to-risk ratio of better than 3.6 to 1. The typical hold time is around two weeks.
Since this signal fired, the stock is already up more than 6%.
If you’re in the stock as a short-term trade, $230 is worth setting as a price alert over the next two to three weeks – this signal’s typical hold time.
If you’re not, consider jumping into this trade to take advantage.
And I should note, a brand-new volatility expansion signal has fired on NVDA as of yesterday’s close, too – this one pointing for a 6.4% average winning gain and an 80% accuracy rate. So there’s even more evidence that NVDA has room to run.
A quarter of the breakout screen just turned into a gold mine…
Every day, I scan the market for high-quality stocks hitting new 1-month highs. This helps me spot emerging trends.
And right now, gold and silver miners are showing up in droves – 27 in yesterday’s screen alone.
That’s a big change from what we saw at the start of the summer.
In May, this screen was dominated by AI chip stocks and software companies, and there wasn’t a single gold or silver miner making the cut.
Why is gold and silver showing up now?
This month, the Treasury said it would sharply step up its buying of long-term government bonds – after weak demand pushed borrowing costs to their highest in nearly 20 years. When Washington has to prop up its own bond market, it makes investors nervous. And they reach for gold as a safe haven.
Lower bond yields also make gold – which pays no income – more attractive on a relative basis.
Gold has climbed from $4,424 to $4,730 an ounce since that announcement – a nearly 7% jump.
One gold and silver stock on yesterday’s screen worth paying closer attention to is Hecla Mining (HL).
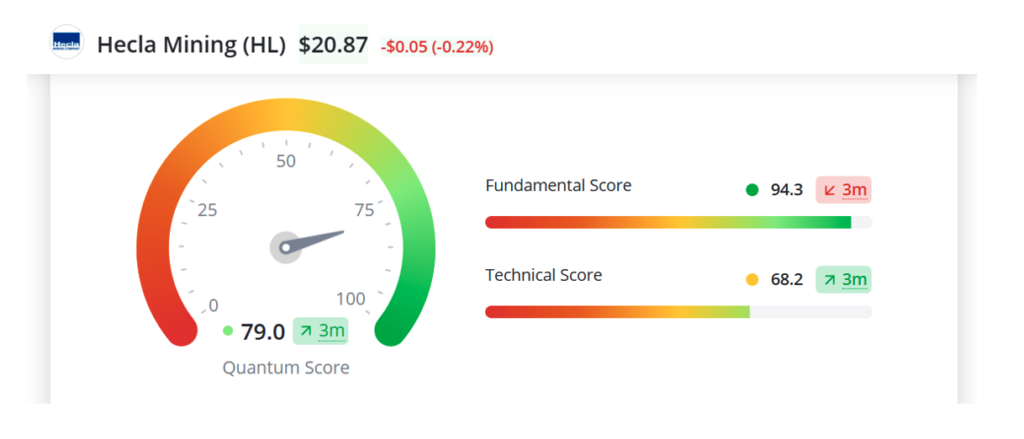
Hecla carries a Quantum Score of 79 – comfortably above our 75 buy threshold.
Our Quantum Score rates every stock from 0 to 100 by combining fundamental strength with technical momentum, tracking where strong businesses and heavy institutional buying line up in the same place.
Hecla’s Fundamental Score is at 94.3, among the highest of any stock we track, even though it’s ticked down slightly over the past three months.
Its Technical Score, meanwhile, has climbed to 68.2 and has risen over the last three months.
That’s on the low end, but it reflects the mismatch between HL’s price action and its underlying business.
If you already own Hecla, keep holding. If you don’t, it’s worth adding to your watchlist to play the precious metals comeback.
The smart money is already positioned in gold…
At this week’s 30-Day Wealth Accelerator event, our CEO, Keith Kaplan, unveiled a new way to track how Wall Street’s best-connected traders are positioning themselves in the options market.
Here’s why that matters.
The biggest, fastest gains in the market almost always come from surprises – an earnings beat, a buyout, a new government contract. News like that forces the market to reprice a stock in a hurry, sometimes 10% or 20% in a single day.
But someone almost always knows before you do. Well-connected traders on Wall Street tend to place their bets ahead of the news – and they often do it in the options market, where a small sum can control a large amount of stock.
By the time the announcement hits the headlines and the rest of us hear about it, the move is mostly over.
Smart Money Edge is built to spot those bets as they’re being placed. It watches for unusual options activity – the footprints big money leaves behind when it’s positioning for something the public doesn’t know about yet.
That gives everyday investors a chance to follow the smart money in, instead of showing up after the party’s over.
Today, Smart Money Edge is flagging unusual options activity in the VanEck Gold Miners ETF (GDX), which lines up with the gold breakout.
If you haven’t watched the replay yet, it’s still up – and it walks through the three stocks Keith flagged live, plus a full walk-through of how Smart Money Edge works. Check it out right here.
To building wealth beyond measure,

Michael Salvatore
Editor, TradeSmith Daily