Ride the AI Melt-Up – Survive the Meltdown
Listen to the audio version of this article (generated by AI).
You could have owned the best stock of a generation and still lost money on it.
Most people did.
In 1997, a money-losing online bookseller went public at $18 a share. It had never earned a dime.
But if you’d put $10,000 into Amazon that morning and never touched it, you’d be sitting on more than $30 million today.
The catch was everything in between.
To make those gains, you’d have had to stomach a 90% plunge – from about $107 a share in late 1999 to $6 by 2001 – and refuse to sell.
Few could do it. Most read the headlines, watched their savings bleed out, and bailed near the bottom. The internet was real, and Amazon was an elite way to play it. But fear is a powerful thing. And most people just couldn’t handle it.
If you’ve been riding Nvidia, Micron, or any of the big AI plays this year, you’ll know something about how that feels – blowout earnings one week, red screens the next, and headlines asking whether the AI trade is cracking.
That doesn’t mean it’s time to bail. As I’ve been showing you over the past two years, we’re in what I call a Mega Melt-Up – the kind of market that mints the biggest fortunes in history. And I’d hate for you to miss it.
What it does mean is that you have to do something that doesn’t come naturally: Stay bullish and careful at the same time.
So today, I’ll show you why every melt-up in history has ended the same way – and why I’m still bullish anyway.
We’ll look at the real danger in a market like this. (It isn’t the crash most people fear.) Then we’ll wrap up with the one move you can make right now, before the next scary drop, so a routine pullback can’t panic you into selling at the bottom.
First, one truth about the market I want you to burn into your memory.
Every Melt-Up Has Ended the Same Way
Every melt-up in history has ended in a meltdown – every single one.
In 1929, the Dow ran up about 500% into its peak, then crashed 89%. Anyone who bought at the top waited 25 years just to break even.
Japan’s stock market tripled in the late 1980s, then plunged 80%. It took investors 34 years to climb out of that hole.
The closest mirror to today, though, is the dot-com boom.
Through the late 1990s, the tech-filled Nasdaq ran from about 750 to more than 5,000 points in five years – a gain of more than 500%.
It was built on something real: a new general-purpose technology, the internet, that promised to transform the world. But the prices people paid to own a piece of that boom drifted further and further from reality.
When reality caught up in March 2000, the Nasdaq plunged almost 80%. It didn’t make new highs until 2015.
A trend can be real, and the price you pay to bet on it can still be too high. We’ve seen that happen across history. And it’s something that should never be far from mind when you’re investing in a go-go market like we’re in today.
I’m not cashing out yet.
In 2000, the market’s hottest companies were priced on dreams. A lot of them had no profits at all. Today’s AI giants are another animal. Google, Microsoft, Nvidia – they make real money, hand over fist. And the spending driving this boom isn’t a bet on demand that might show up someday. It’s chasing demand that’s already here.
But I won’t pretend this boom can’t end – because history is undefeated on that point.
The good news is that a meltdown, in and of itself, has never been what ruins you. It’s what you do while the market is plunging that gets you into trouble.
The Best Days Hide in the Worst Weeks
Here’s an example of what I mean from a study by J.P. Morgan Asset Management.
If you’d put $10,000 into the S&P 500 at the start of 2005 and left it alone, you’d have had about $71,750 by the end of 2024.
Now, watch what happens if you got clever and tried to dodge the bad days. Miss just the 10 best days over those two decades, and your money grows to only $32,870 – less than half. Miss the 30 best days, and you’re down to about $13,760 – barely more than you put in.
How does missing 30 days out of 20 years cost you that much?
Because the best days come packed in right among the worst ones. J.P. Morgan found that 7 of the market’s 10 best days fell within two weeks of its 10 worst days. Sell in the panic, and you all but guarantee you’ll be in cash when the biggest up days hit.
So why do folks sell at the worst possible moment? Usually, it comes down to one thing: They own too much of the same bet.
A 20% pullback in an AI play is routine. That won’t cause you much heartburn. But when one stock makes too much of your account, a routine drop can feel like an emergency. And you sell at or near the bottom.
So how do you keep a normal drop like that from panicking you into selling?
You spread out your risk now, while the market’s calm and your head is clear.
Even Out Your Risk Before the Storm
Most people think about diversification in dollars. They spread their money across, say, 10 stocks in more or less equal chunks and figure they’re covered.
But dollars aren’t the same as risk.
You can have the same dollar amount in a calm, steady stock and a wild, jumpy one. And they’ll pull on your portfolio with completely different force. One barely moves. The other can swing 40% or 50% in a normal year.
A portfolio that looks balanced on paper can be dangerously lopsided, with two or three jumpy names driving almost all of your ups and downs.
The fix is to balance by risk instead of by dollars – less money in the jumpy stocks, more in the steady ones, so no single stock can capsize you.
You can start today with a simple gut check:
- Count how many genuinely different stocks you own. Ten AI-related plays aren’t the same as 10 diversified stocks. That’s one concentrated position, split 10 ways.
- Look at your biggest positions. Are they all riding the same trend? Or have you spread them out over different trends?
- Ask what you own that tends to zig when stocks zag – cash, bonds, gold. These hedges act as a brake on the way up, but they’re a much-needed buffer on the way down.
To do the math precisely, we built a tool called Risk Rebalancer. It looks at every stock you own and measures how much it normally moves in a typical year – its own volatility “personality.”
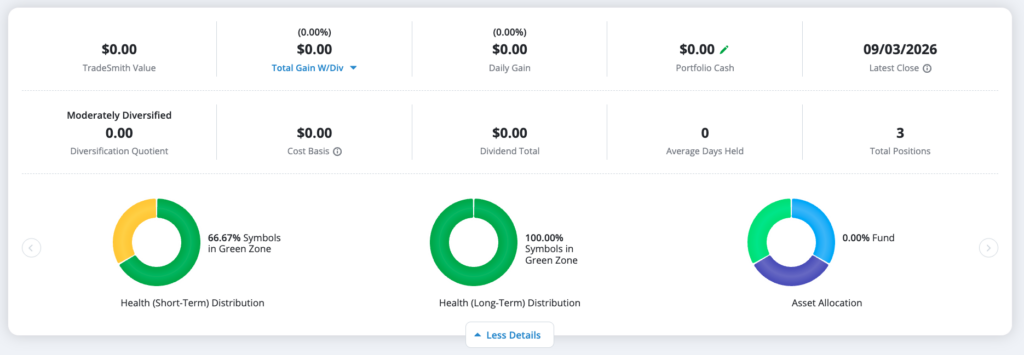
Then it shows you how much to trim from your jumpiest positions and shift into steadier ones, so every holding carries a roughly equal share of the risk. You can run the whole thing in a couple of clicks. This quick sample portfolio of MU, NVDA, and SPY that I put together will show what my risk might look like:
Whether you use our software or not, even out your risk now while the market is still relatively calm. Don’t wait until we’re in the middle of the next big drop, when fear is already making your decisions for you.
Do it today, and you can watch a scary week go by, shrug, and stay in for the recovery – like the few Amazon holders who didn’t flinch and made a fortune as a result.
All the best,
Keith Kaplan
CEO, TradeSmith
P.S. Risk Rebalancer is available to TradeStops Premium, Pro, and Lifetime members, as well as Trade360, TradeSmith Essentials, and TradeSmith Platinum members. If you don’t see it on your dashboard – and would like to – call our Customer Care team at 888-623-0858 to learn more.