This AI Beat Stocks 3-to-1 This Year – Before the Newest Breakthrough
Listen to the audio version of this article (generated by AI).
Predictive Alpha is TradeSmith’s proprietary AI forecasting system. Thousands of our subscribers use it every day to find short-term trades with high-probability price targets.
It also powers our Super AI Portfolio, a constantly rotating basket of five stocks that beat the market 3 to 1 through August of this year.
Since we first launched Predictive Alpha in spring 2023, we’ve put it through three major upgrades. Version 4, which just shipped, is our most significant leap yet.
That’s why I invited our Chief Quantitative Strategist, Mike Carr, to talk about what’s new.
Before joining TradeSmith, Mike spent years writing code for the U.S. Air Force and working in cryptography for the Pentagon.
He later became a money manager who more than doubled the S&P 500’s return coming out of the financial crisis – without owning a single individual stock.
Now he’s the architect behind many of TradeSmith’s most powerful tools, including Predictive Alpha.
Here’s our conversation…
Michael Salvatore, Editor, TradeSmith Daily: Mike, Predictive Alpha just hit version 4. We’ve been building toward this for the better part of four years now.
What’s new in v4 that makes this a game changer for our subscribers?
Mike Carr, Chief Quantitative Strategist, TradeSmith: The major change is that we’ve moved to an “ensemble” model. So instead of one model, we’re now running two simultaneously.
The original model – which has been the backbone of Predictive Alpha since we launched – uses pure price action and nothing else. And it’s been remarkably strong on its own: over 70% accuracy, consistently, at finding trades that reach their target price.
But as the technology has evolved, we’ve found ways to layer in additional signals that make it more responsive and more consistent.
So the new second model incorporates short- and long-term momentum, volume, and – for the first time – industry group designations.
That last one is new territory for us. It’s the first time we’ve been able to use non-numerical information in the model that actually improves results.
Michael Salvatore: Why does the industry group matter so much?
Mike Carr: Think about what happens when Walmart announces earnings. If those numbers come in strong, Target is probably going to move, too – because they’re in the same industry group.
Markets process that relationship, but it takes time for a pure price model to catch up after a big move like that.
By incorporating industry groups, we’re able to adapt more quickly when news events hit an entire sector, not just a single company.
And the results bear that out.
Across 1.5 million projections – running constantly across thousands of stocks – this ensemble upgrade has increased the share of projections that reach their target price by 7.5%.
That may sound like a small number, but when you’re talking about that many forecasts, it’s a meaningful edge.
Michael Salvatore: So now you have two models running in parallel. How do subscribers actually see that in the platform? Walk me through what’s changed in the interface.
Mike Carr: The biggest addition is what I’d call the projection context layer. Let me use Dell as an example, because it’s a stock we’re currently tracking with a strong signal.
Today, Sept. 17 as we’re recording, Predictive Alpha is showing a 9.9% projection for Dell Technologies (DELL) over the next 19 days. And projections on DELL have been accurate 94.53% of the time in the past.
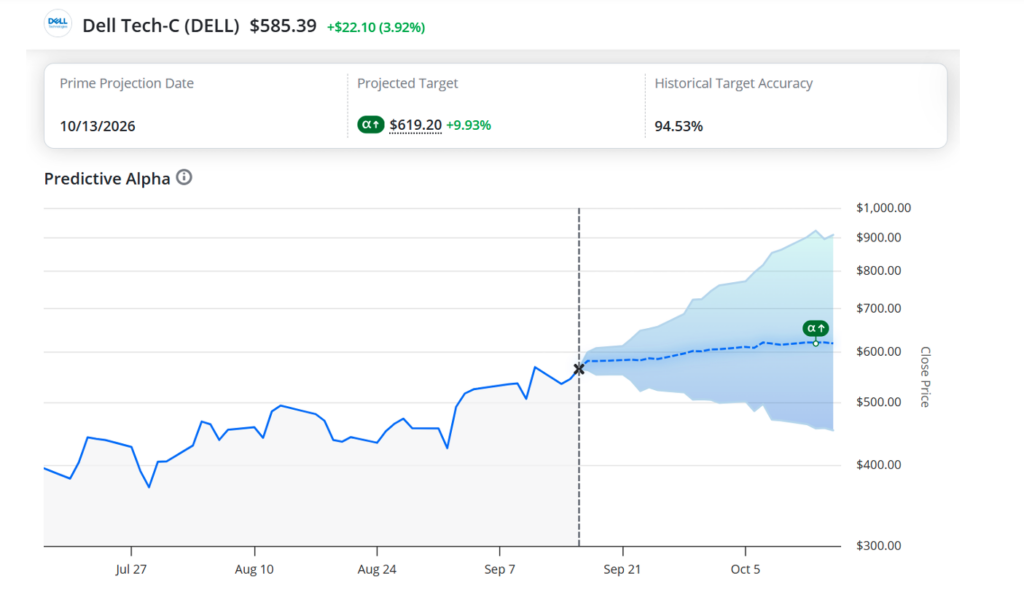
That’s a big number.
But the question you should always ask is: when this model makes a projection this large, how often does it actually hit?
That’s what the new interface answers. We took every projection for Dell going back over the past year, sorted them from high to low, and assigned each one to one of five buckets.
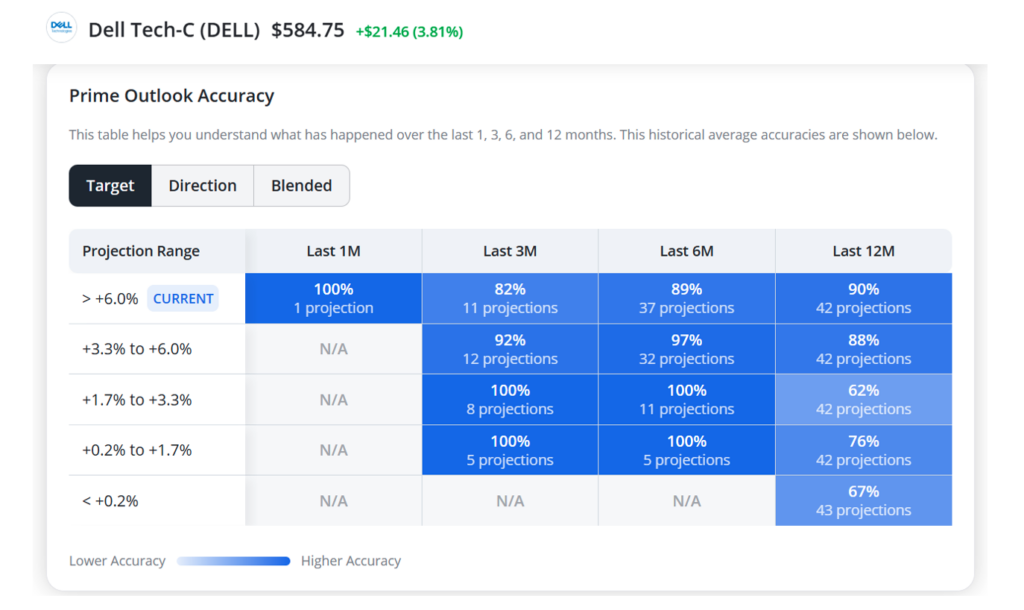
Dell’s current projection puts it in the top bucket – the biggest forecasts this model has made for this stock. And when you look at that bucket over the past 12 months, the accuracy is 90%.
But it goes further. At the six-month mark, for projections in the 3.3% to 6% range, we’ve seen 97% accuracy out of 32 projections. So we can see that those smaller projections have even higher confidence.
Michael Salvatore: And I see that on the smaller forecasts, from 1.7% to 3.3%, Predictive Alpha was actually less accurate over the last 12 months. 62% of those forecasts were accurate – still not bad, but not as good as what we just looked at.
Mike Carr: Exactly, and that’s counterintuitive until you see the data.
A small projection sounds safer. But what the historical record shows is that when the model is making a small call on Dell, it’s actually less reliable.
The high-conviction signals are the big ones. That’s what the bucket system is designed to show you. And that’s different for every single one of the thousands of stocks we track with Predictive Alpha.
Michael Salvatore: You’ve also added a directional accuracy tab. What can subscribers learn from that?
Mike Carr: This is where it gets especially useful for options traders.
Some strategies don’t care how big a move is – they just need to know which direction the stock is going.
A spread trader, for example, is betting on direction, not magnitude.
For Dell’s current top-bucket projections, the directional accuracy is 98%. That means when the model makes a forecast this large for Dell, it’s called the direction correctly 98% of the time over the past year. That makes Dell a strong candidate for a spread trade – there’s a high degree of confidence it’s going to go up from its last closing price.
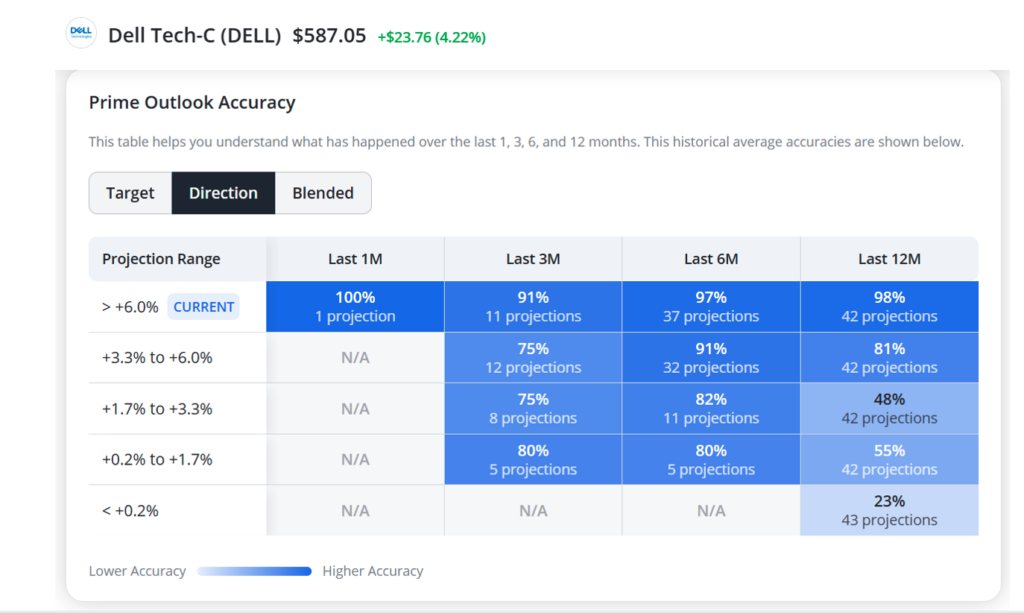
But you can also flip it around – if you’re someone who sells options and wants a stock to stay still, Dell is not your play here. A 9% projection with 98% directional accuracy is telling you this stock is likely to move, and move confidently.
And all of the small-move projections were less accurate. That means if you’re selling options, there’s a lot more risk.
Michael Salvatore: Let’s talk about two other features in the new interface: the anomaly flag and model agreement. What should subscribers know about those?
Mike Carr: The anomaly flag is something we’ve been monitoring internally for a while, and now we’re surfacing it directly to subscribers.
When a projection falls outside the model’s expected range of behavior, it gets flagged as an anomaly.
What that means in practice is not that the trade is bad – it’s that volatility is likely to be higher than average.
So if you see an anomaly flag on a stock showing a 9% projection, I’d interpret that as: expect a 15% move or more, in either direction. That’s useful information when you’re sizing a position or deciding which options strategy fits.
For Dell today, there is no anomaly flag. So the forecast is behaving as expected.
Michael Salvatore: And model agreement?
Mike Carr: When both ensemble models – the price-only model and the indicator model – point in the same direction on a forecast, we flag that as agreement. When they agree, confidence is very high.
When they disagree, confidence is still high – just not very high.
It’s a meaningful distinction. For Dell today, the models are not in agreement. That’s the case about half the time across stocks.
But I want to be clear: disagreement doesn’t mean to avoid the trade. It means treat it as high confidence rather than very high confidence and use the bucket and directional accuracy tables to inform your position sizing.
Michael Salvatore: And all of this connects to the Super AI Portfolio – which has been having a standout year. Can you give subscribers a sense of how Predictive Alpha v4 feeds into that?
Mike Carr: The portfolio is essentially Predictive Alpha in action at scale. The updated model feeds into our stock selection algorithm, which finds the trades with the highest-probability forecasts.
Then a portfolio algorithm sits on top of that – it’s not just picking the best individual stocks… it’s finding the best combination of stocks to hold right now.
The approach is short-term and rotating. Once a stock hits its projected target, it comes out and something new goes in.
This year, that approach has beaten the market by three to one. And it’s done that through some genuinely turbulent stretches – the tariff volatility, geopolitical uncertainty, and earnings whipsaws. The model has kept finding opportunities through all of it.
Michael Salvatore: And right now, for anyone watching who hasn’t used Predictive Alpha before, there’s actually a way to try it out for free.
Mike Carr: That’s right. Through Sept. 22, anyone can test drive the tool at no charge.
It’s part of our Super AI Trading Event, which our CEO Keith Kaplan is hosting.
I’d encourage people to use that time to get comfortable with the interface in the lead-up to the event. Test out whatever stock you want to throw at it and see if there are any strong projections over the coming weeks.
Michael Salvatore: Mike, this has been incredibly useful.
V4 is a big leap – not just in accuracy, but in giving people the information they need to actually act on what the model is telling them. Thank you for walking us through it.
Mike Carr: My pleasure. I think subscribers are going to find it very useful.
Michael Salvatore here…
Mike just showed you that Predictive Alpha v4 doesn’t just make a call – it gives you deep layers of statistical information to help you plan your trades.
That gives you an edge unlike any other AI-powered trading system out there.
And for the next few days, you can put that edge to work yourself – free.
Pull up any ticker in your watchlist and see where our AI sees the stock moving up to 21 days out, with accurate rates 85% and higher.
And keep an eye on your inbox. Our CEO, Keith Kaplan, has some other exciting bonuses prepared for you in the lead-up to the Super AI Trading Event on Tuesday.
To building wealth beyond measure,
Michael Salvatore
Editor, TradeSmith Daily