What to Do Before Treasurys Bottom
Listen to the audio version of this article (generated by AI).
In This Digest:
- Our systems flagged this bond breakdown two months early
- This overlooked industrial stock is already beating the bond storm
- Mid-caps just flashed a key risk-off signal – what it means
Six years of bond market pain just turned into an opportunity…
The 10-year Treasury yield hit 5.2% last week – the highest level since 2007. The 30-year climbed to 5.5%, right at its 2004 peak.
Government bonds have been in a brutal bear market since 2020 as inflation has driven investors to demand higher yields on U.S. debt.
As yields rise, bond prices fall. And for the past six years, that relationship has punished anyone holding long-term Treasurys through what was supposed to be the “safe” side of a portfolio.
At 5%-plus, the 10-year now pays more than the dividend yield on nearly every stock in the S&P 500 – with none of the earnings risk.
When cash and Treasurys pay that kind of return, some of the money that would otherwise chase stocks stays put instead.
And the sectors most dependent on cheap capital – real estate, high-growth tech, anything financed with debt – feel that pressure first.
But what if we’re already close to the end of the current yield panic?
Only the most dedicated Daily readers will recall that back in October 2023, during the last big yield panic, I made the case in this newsletter for a short-term speculative bounce on the iShares 20+ Year Treasury Bond ETF (TLT).
Treasury prices had gotten so beaten down that sellers were exhausted, and the technicals suggested signs of a bottom forming even in a longer downtrend.
It worked. TLT rallied 20% by year’s end as the 10-year retreated toward 4%.
I think we’re looking at a similar setup building today.
To be clear, I’m not calling a bottom in yields yet. And our data agrees.
Short-Term Health, TradeSmith’s most sensitive momentum indicator, has had TLT in a Red Zone since July 23 – when the ETF was trading at $82.79. TLT closed today at $78.67, down another 5% since that signal fired:
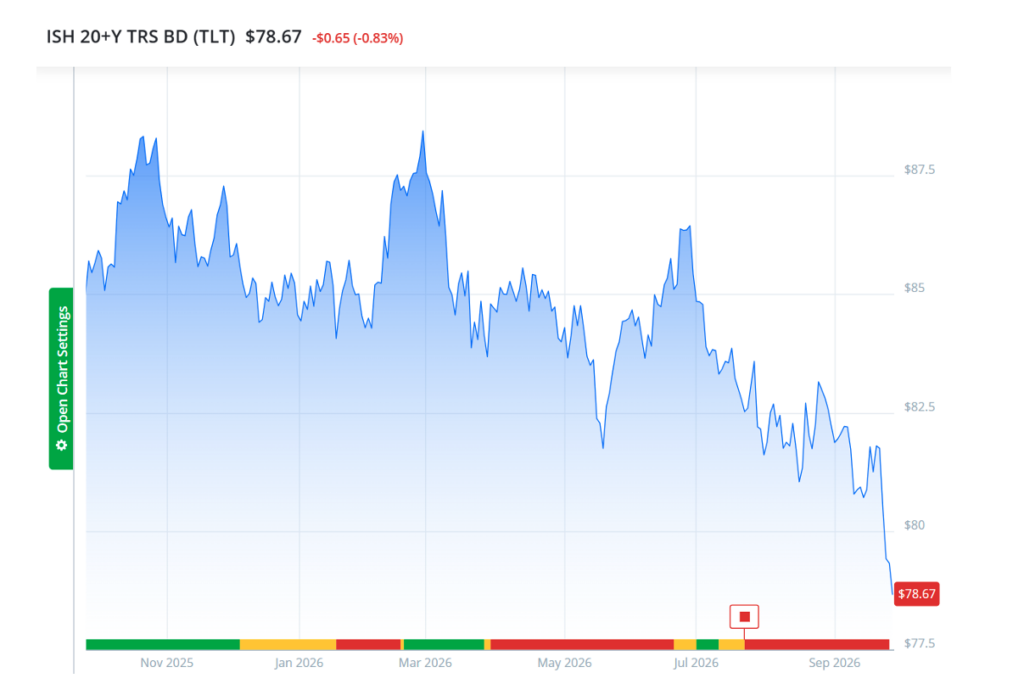
Short-Term Health flags whether a stock is trending up (Green), losing momentum (Yellow), or breaking down (Red) over the near term.
Until Short-Term Health turns back to Yellow or Green, this isn’t a buy signal on bonds. It’s confirmation the pain isn’t over yet.
But just like they did back in October 2023, bonds will bottom out and pave the way for another leg higher in stocks. And so the time to prepare for that moment is now.
Bond pain doesn’t hit every sector the same way…
It’s important to understand that while higher yields put pressure on stocks, they don’t push everything the same way.
Some sectors get hit hard and recover first. Others limp along for months.
I went back to the last major yield panic – October 2023 – and mapped which S&P 500 sectors reclaimed new highs fastest once the pressure broke. Technology and Communication Services led the way. Industrials and Consumer Discretionary weren’t far behind.
Those also happen to be the sectors that get hit hardest when rates rise in the first place.
So buying into them now and trying to call a bottom carries real risk. But we can still prepare for that moment.
Late last week I ran a screen across those four leadership sectors, looking for high-quality companies already showing early signs of stabilizing.
The main filter was our Business Quality Score.
Business Quality Score is TradeSmith’s read on the underlying business itself – growth, profitability, balance-sheet safety, and payout, weighted into one 0-to-100 number. Think of it as a credit score for the company, not the stock chart. Above 75 means a financially sound business, independent of what the price is doing.
We’re also looking for stocks where Short-Term Health is in a Yellow Zone and prices are down over the past month.
That screen returned 17 names as of Friday. The top five by BQS are Expedia (EXPE), Copart (CPRT), Ross Stores (ROST), W.W. Grainger (GWW), and Dollar Tree (DLTR):
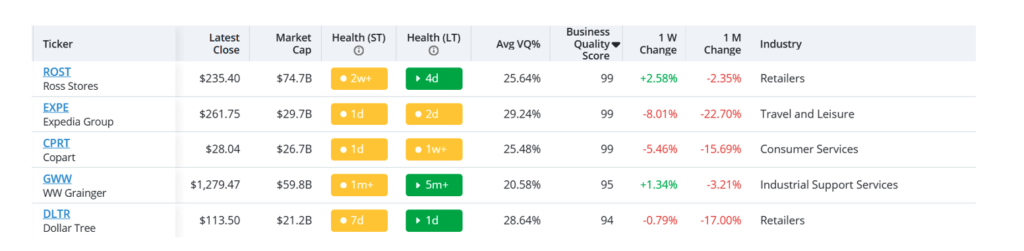
Two of them – EXPE and CPRT – are Yellow on both Short- and Long-Term Health, and down over both the past week and month.
Those are names under real pressure, not just catching a short-term air pocket.
The other three – ROST, GWW, and DLTR – are Yellow on Short-Term Health but Green on Long-Term Health, which tells you the primary trend is still intact. This is a pause, not a reversal.
GWW is the standout. It turned Short-Term Health Green on Oct. 30, 2023 – right at the peak of that last yield panic – and kept climbing into year-end.
And it’s up more than 22% since its most recent Short-Term Health Green signal on Dec. 22, 2025, outperforming the S&P 500 by nearly 2-to-1 over that stretch.
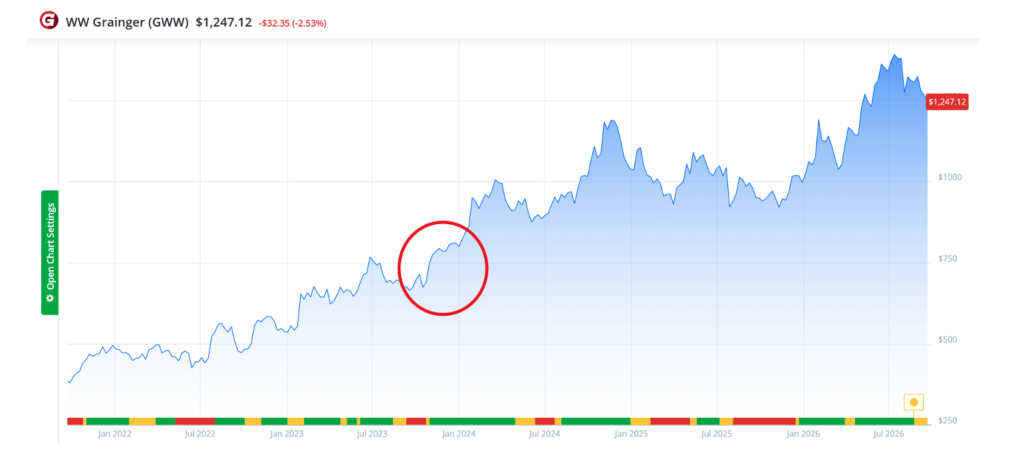
GWW is a real “steady eddy” industrial supply company. You can’t expect it to bring in explosive gains even in the most favorable environment.
Regardless, add GWW along with ROST and DLTR to your watchlist. If yields keep climbing and these stocks don’t fall apart, that’s where I’d look first for buys on sale.
Meanwhile, mid-cap stocks just walked into the same yield storm…
PSA: The S&P 400 – the index tracking mid-cap stocks – just turned Red on our Short-Term Health indicator.
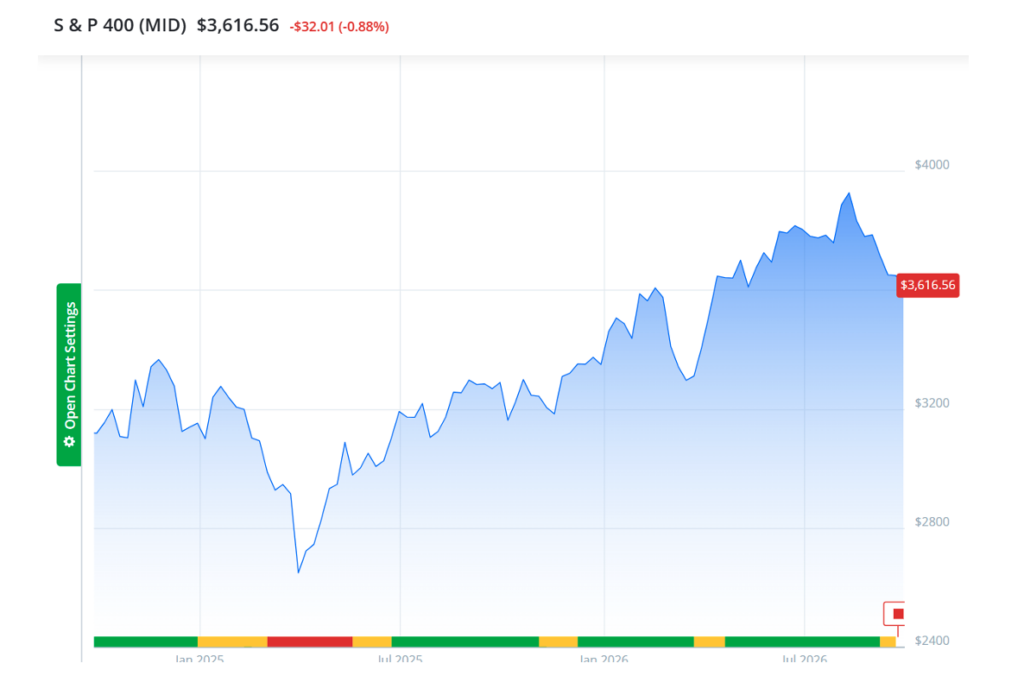
Short-Term Health has had this index in a Green or Yellow Zone since June 23, 2025, when it sat at $3,102.77. That’s a 16.6% run.
But our system is saying now that the trend has met its end.
It’s not surprising. Mid-cap companies typically carry more debt relative to their size than large caps, and they have less access to cheap, flexible financing when it disappears.
So when long-term yields climb the way they have these past few weeks, mid-caps feel it.
If you’re holding individual mid-cap stocks – anything between about $8 billion to $23 billion going by the S&P 400’s rules – take a hard look and see if it’s time to take profits or cut your losses.
If you’re a paid-up subscriber to our Trade360 suite of tools, it’s worth pulling up their individual Short-Term Health status to help you decide.
To building wealth beyond measure,
Michael Salvatore
Editor, TradeSmith Daily