Where Elon’s $100 Billion Is Headed
In This Digest:
- You can either fear AI spending, or trade the stocks that benefit from it
- Our Smart Money Edge flagged a biotech four days before it jumped 170%
- The Fed’s first hike in three years says these stocks are “dead money” for the next year
AI spending is only a problem if you don’t know where it’s going…
Throughout September, tech stocks have taken gut punch after gut punch.
Long-term Treasury yields are climbing to multi-decade highs above 5%, providing uncomfortable competition for stocks.
At the same time, investors are growing increasingly wary that the AI hyperscalers are spending too much, too fast, on a technology nobody can prove is actually making money yet.
The numbers reflect the fear. On its last earnings report, Meta reported that its free cash flow fell 91%. Alphabet posted its first negative free cash flow since going public in 2004.
I get why investors are spooked. All this spending is not leading to a payoff – at least, not for the big tech companies everyone knows about.
But you have to understand that this AI infrastructure spending doesn’t just vanish into the ether.
It goes to the company that builds the turbines… the one that pours the concrete… the one that cools the servers.
And this earnings season, that spending will start showing up on someone else’s books…
Just think about it…
SpaceX (SPCX) went public in June at the highest valuation for a new listing in market history.
That listing put roughly $75 billion in fresh cash in Elon Musk’s hands, and we’re about to wrap SpaceX’s first full quarter as a public company.
So every downstream contract that money touches is about to show up in a filing.
That’s the word from Andy and Landon Swan, who head up our Earnings Season Pass advisory.
There, they use their Earnings Score system to guide them to profitable short-term earnings report trade setups.
The Earnings Score doesn’t read stock charts or try to guess at revenue numbers.
Instead, it reads customers – pulling in more than 500 million daily data points from social chatter, app downloads, search traffic, and web activity.
That data grades how a company’s earnings reaction is shaping up before Wall Street’s estimates catch up.
The gap between what Wall Street expects and what the data already shows – that’s where the Swans think this earnings season gets made.
They’ve got the track record to back it up.
- A +27 Earnings Score on Deckers Outdoor (DECK) turned into a 275.0% gain in a single trading day this May.
- A bearish score on Netflix (NFLX) ahead of a soft Q2 print brought in 104.2% in four days.
- One reader, Ross K., caught Snowflake (SNOW) on their scorecard days before Amazon (AMZN) and Snowflake announced a $6 billion computing deal, banking almost 40% overnight.
The Swans are holding a briefing on what they’re calling Elon’s “October Sweep” – how this AI money trail could shape the biggest surprises of the coming earnings season.
Add your name to the list now for early access to their urgent briefing.
A quiet biotech just proved our newest tool right …
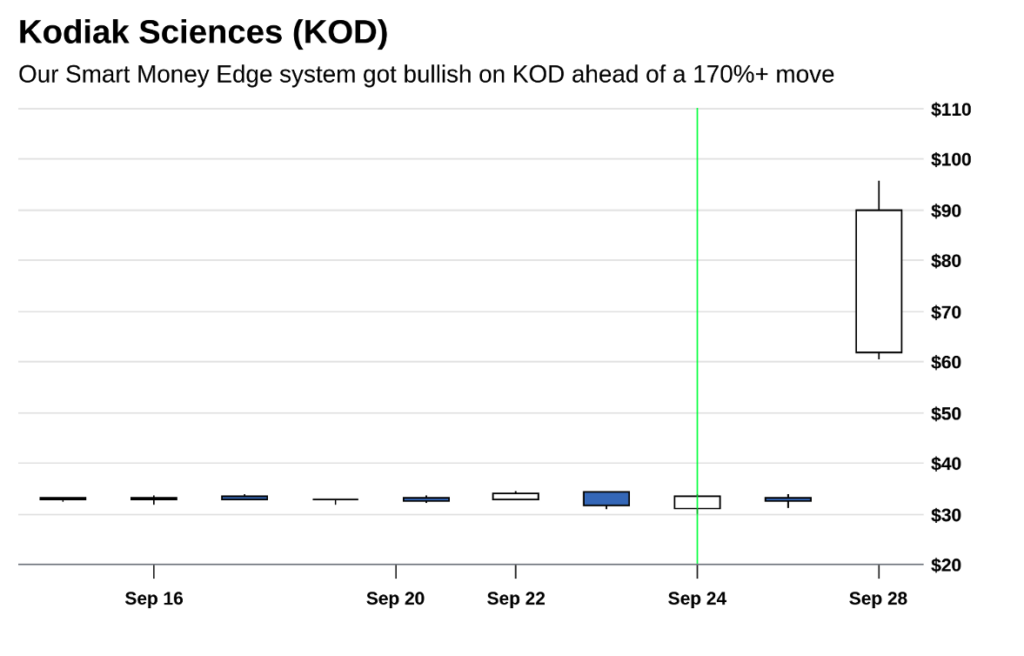
On Sept. 24, Kodiak Sciences (KOD) was barely on anyone’s radar. Just a small eye-disease drugmaker trading like any other Thursday.
But something underneath the surface didn’t look ordinary.
And our Smart Money Edge system caught it.
Smart Money Edge is our tool built to catch what regular investors can’t see happening in the options market.
Every day, it scans thousands of stocks for unusual activity: dollar volume against a stock’s normal 30-day average, whether traders are leaning toward calls or puts, and sudden spikes in implied volatility.
An AI layer then filters out the noise, flagging only the trades that break from a stock’s normal pattern – not just stocks that are naturally busy with options traffic.
In backtesting, roughly 75% to 80% of Smart Money Edge’s flagged trades have moved favorably within about 30 days.
Think of it like a smoke detector. It stays quiet through the everyday cooking smoke and only goes off when something’s actually burning.
On Kodiak, it went off. And four days later, on Sept. 28, Kodiak announced positive results on a new treatment for age-related macular degeneration – one of the most common causes of vision loss in older adults.
The stock jumped more than 170%, adding billions to its market cap in a single session:
I can’t tell you Kodiak’s next move from here – the trade tied to this specific signal has already played out.
What I can tell you is that Smart Money Edge is still scanning, every day, for the next stock about to have its own big move.
Subscribers should monitor the daily reports of new Smart Money Edge trades carefully – especially any that pop up in the biotech sector.
It’s time to clean house in your portfolio…
On Sept. 16, the Federal Reserve raised rates for the first time in more than three years, pushing the federal funds rate to a range of 3.75% to 4.00%.
Everyone and their dog has a take on what happens when the Fed raises rates. But nobody outside of TradeSmith can tell you which stocks to own and which to ditch when this happens.
So I asked our Chief Quantitative Strategist, Mike Carr, to go back and check.
He pulled every Fed rate-hike cycle since 1964 and split the market in two: stocks that were Green on Short-Term Health when the hike hit, and stocks that were Red.
Short-Term Health is TradeSmith’s most sensitive trend indicator. It looks at how a stock has been trading against its own recent history and flags a shift in momentum – Green means the trend is healthy, Red means it’s broken down.
Long-Term Health does the same job on a longer horizon, built for buy-and-hold investors instead of traders.
The split was stark. Stocks that were flashing Green on Short-Term Health when the Fed first hiked returned an average of +8.4% over the next 12 months. Meanwhile, red stocks returned +0.1%.
Green held the edge at every stage – smaller losses at one and three months, positive by six months and well ahead by 12.
Long-Term Health told a similar story. Green stocks averaged 7.3% gains over the 12 months after a first hike, against 4.5% for the S&P 500 over those same windows.
Stack both together, and the gap widens further. Stocks Green on both Short- and Long-Term Health averaged +8.7% over 12 months.
Red stocks on both didn’t just lag – they fell roughly twice as hard in the first three months, down 10.6% against a 4.3% decline for the both-Green group.
We don’t need to guess how this plays out. Here at TradeSmith, we’ve got 60 years of rate-hike cycles telling us.
If you’re holding long-term positions right now, this is a good moment to take a hard look at locking in gains.
And if you’ve got short-term trades sitting in the Red, Short-Term Health’s history here argues for cutting them loose, rather than hoping they turn.
Since the Sept. 16 hike, 22 of the stocks in the S&P 500 have turned Red (or were already Red) on their Short- and Long-Term Health indicators. The five most recent signals are below:
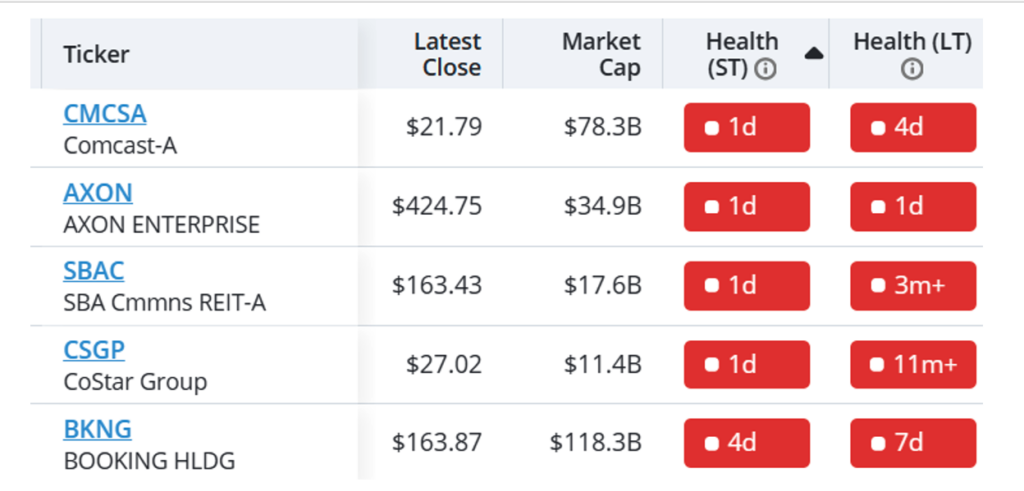
If you own any of these stocks on either timeframe, it’s time to seriously consider whether you want to hang on to them. Because the data suggests they’re dead money for the next year.
To building wealth beyond measure,
Michael Salvatore
Editor, TradeSmith Daily
At the time of this writing, Michael Salvatore held shares of SPCX and GOOGL.