This TradeSmith Tool Turns Main Street Buzz into Buying Opportunities – Before Wall Street Catches On
It always pays to know where Americans are spending their money – after all, domestic consumer spending accounts for roughly 70% of the U.S. economy.
But stubbornly high inflation and rising interest rates are conspiring to leave consumers spent.
Last month, the U.S. Consumer Confidence Index tumbled to the lowest level seen this year, and thanks to sharply rising cost-of-living expenses, expectations for consumer confidence are looking pretty dismal over the next six months.
And yet, according to retail sales data, consumers are still spending at a healthy clip… which tells me that American consumers are being more selective than ever about the products and services they’re willing to open their wallets for.
Figuring out what these consumers are embracing – or rejecting – could pay off big time if you can capitalize on the data early enough. And as a brand-new earnings season gets into gear right now, that’s where TradeSmith’s exclusive Social Heat Scores can be worth their weight in gold.
These cutting-edge analytics were developed by TradeSmith Senior Analysts Andy and Landon Swan – the two brilliant brothers behind MegaTrends.
By closely examining consumer preference data – tracking millions of consumer signals across the internet to identify the products and services that people recommend online and actually buy – the Swans have gained a valuable edge in predicting which stocks are likely to outperform.
And the best part is, the Social Heat Scores can often identify opportunities before Wall Street catches on… giving you the chance to enter trades early and secure a tidy profit.
As we look forward to the latest quarterly earnings season, we’ve just launched a major upgrade to our Social Heat Score –one that gives you even more ways to uncover compelling profit opportunities.
Grading Main Street Buzz with TradeSmith’s Social Heat Scores
The Social Heat Score combines real-time consumer engagement stats with market data, enabling it to consistently spot and grade shifts in consumer demand. And increased consumer sentiment can soon show up in a company’s bottom line – boosting its stock price.
Subscribers to TradeSmith Platinum, MegaTrends, and Earnings Season Pass can easily view Social Heat scores for more than 1,000 stocks on TradeSmith Finance – and we’re adding new tickers to the system all the time. Just log in to your platform and scroll down the Home page to find the Social Heat Score, as shown below:
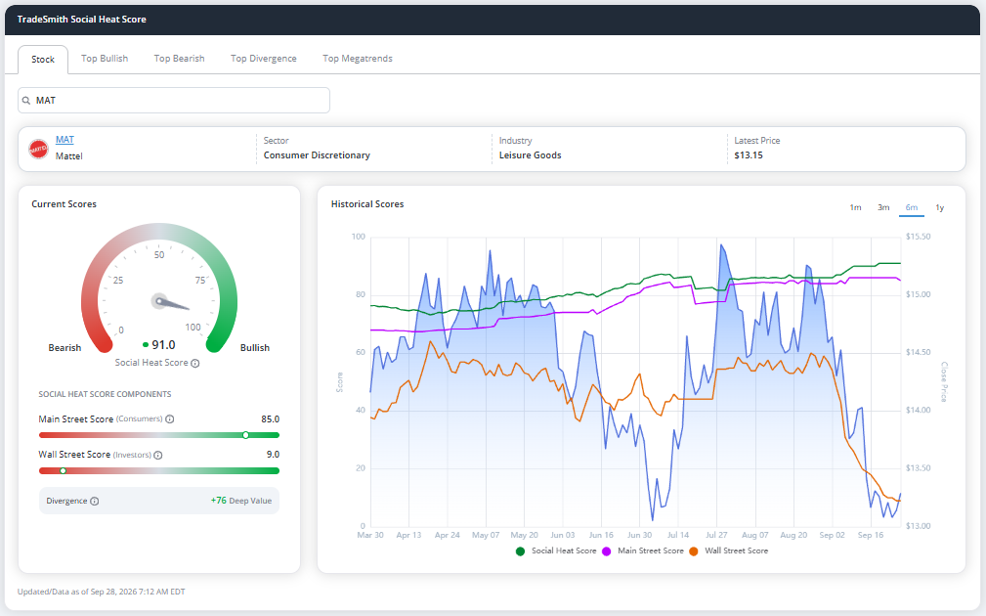
From here, you can search for stocks by ticker symbol, or you can view the current Top Bullish and Bearish Social Heat Scores by selecting the different tabs at the top of the window.
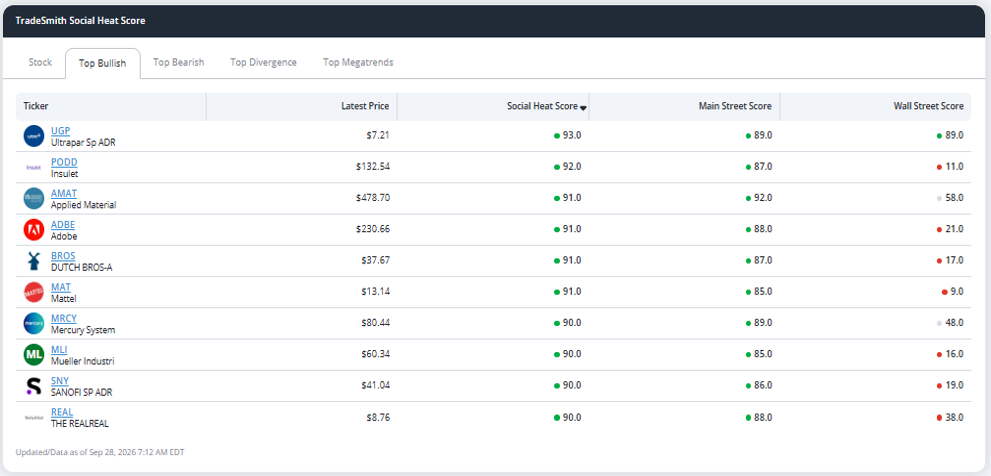
To calculate our Social Heat Score, we tap into real-time social media and search data across the internet, from platforms like Google, X (formerly Twitter), Facebook, Instagram, Reddit and more.
From there, our systems track how consumers “vote with their wallets.”
Every online post is processed by advanced technology that measures consumer engagement and excitement, cross-referenced with a database of over 11,000 brands from over 1000 companies.
It then uses that data to produce meaningful signals. We evaluate four key types of online consumer engagement data:
- Brand Mentions (Buzz): Discussion of any brand, product, or service linked to a specific company…
- Positive Sentiment: Online posts that show satisfaction or enthusiasm…
- Negative Sentiment: Negative posts that show criticism of products and services…
- And Purchase Intent: Posts where people say they’ve bought or plan to buy a product/service.
It’s all boiled down into a single, easy-to-read number ranging from 0 to 100 that reflects how a brand, product, or service is resonating with Main Street consumers.
It’s simple, Social Heat Scores above 60 are bullish, and below 30 are considered bearish. Higher scores indicate sustained consumer buzz.
When Social Heat Scores rise and consumers are buzzing about a company’s products, it can lead to a bullish reaction – and when scores drop substantially, it can signal bearishness ahead.
Diving Into Social Heat Scores and Social Heat Divergences
Let’s take a closer look at the Social Heat Score for Mattel (MAT), so you can see how easy it is to evaluate a stock.
Mattel is an iconic brand that produces a wide range of toys and games for children of all ages: Just think of icons like Barbie, Hot Wheels, UNO, and Polly Pocket.
By searching for MAT in the Social Heat Score window, you can easily track the company’s stock price trends over time along with changes in the Social Heat Score. At time of writing, MAT holds a very high Social Heat Score of 91 out of 100:
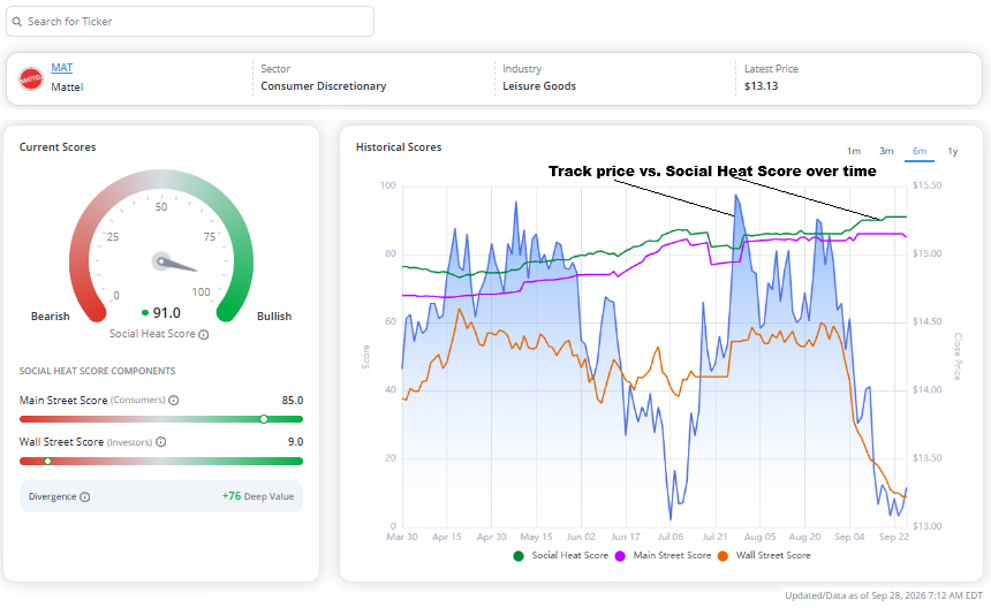
It doesn’t get much better than that… but MAT shares are down over 30% this year!
This tells me its high Social Heat score could very well be the catalyst for a significant rebound rally in the share price.
Take a closer look at the gauges on the left, and you’ll notice that MAT has a very high Main Street Score, based on consumer sentiment. But it’s Wall Street Score, reflecting investor sentiment, is in the dumps like the stock price – with a score of just 9!
And that’s the key to uncovering potentially winning stocks before they make a big move: Find stocks with rising Main Street Scores from consumers, paired with low expectations on Wall Street… and you’re on your way to a hot opportunity!
Alongside the proven Social Heat Score, you should focus on the Main Street Score and Wall Street Score, as graphed below:
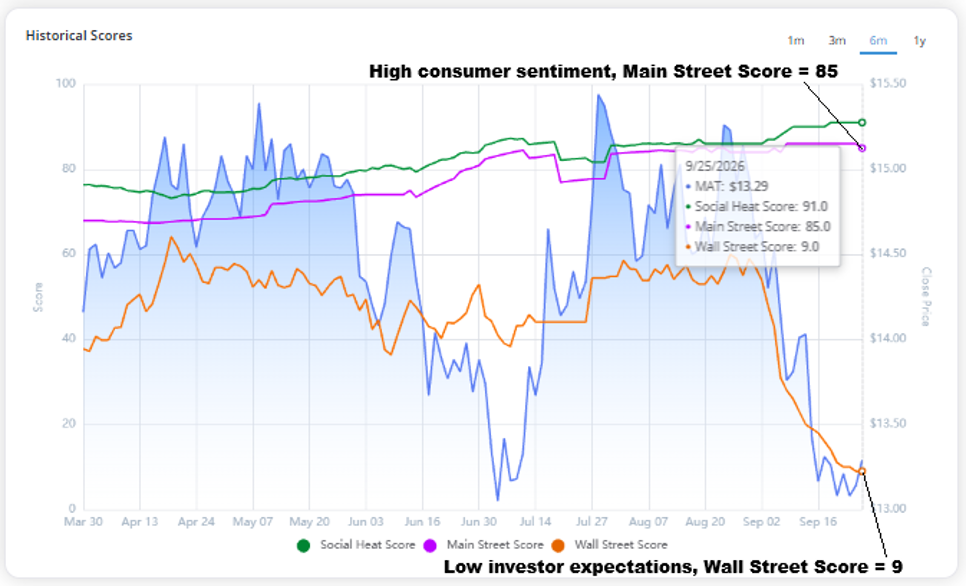
The Main Street Score measures what we care about most – how a company’s products and services are performing with consumers. Higher is better – and at 85, MAT ranks near the top.
The Wall Street Score, on the other hand, reflects what investors currently expect from the company. For MAT stock, Wall Street has low expectations – which means a low bar for the company to clear.
You should pay especially close attention to companies with a strong Main Street Score coupled with a low Wall Street score. The wider this divergence, the more upside potential.
When consumer sentiment is on the rise, it means business prospects may be improving, well before Wall Street analysts or investors catch on.
That’s often the best trade setup of all!
That’s exactly how the Swans found Robinhood Markets (HOOD) before a meteoric 556% price gain… and how the pair entered Oklo (OKLO) before it soared 461%!
And the all-new Top Divergence list in our Social Heat Score tool makes it easy for you to spot these disconnects in seconds, and jump on potentially winning trade setups with just a few clicks:
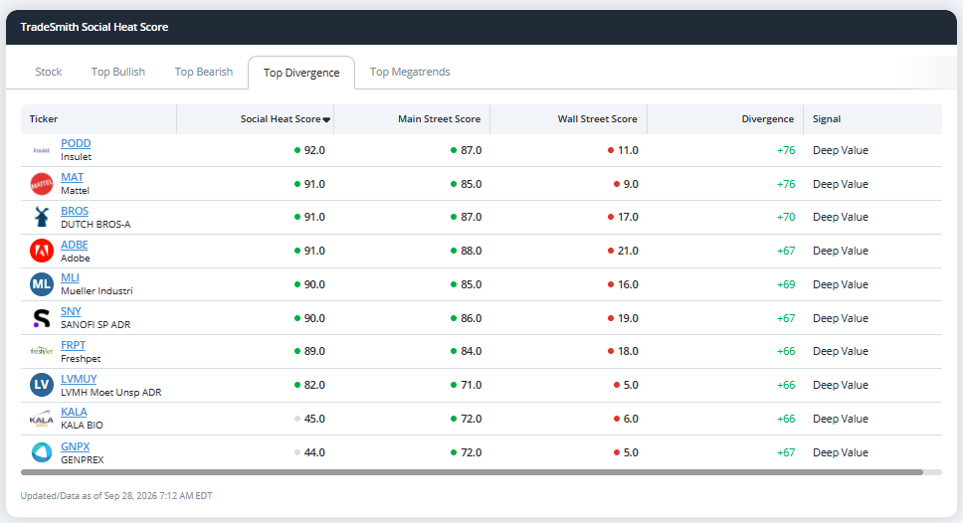
Just click on the Top Divergence tab, and you’ll quickly find stocks where Main Street sentiment is more bullish than Wall Street’s opinion implies. And that’s where you’ll find hidden rebound opportunities.
The Divergence scores on this list measure the distance between what consumer data indicates and what investors are pricing on Wall Street. The math behind divergence itself is simple:
Divergence = Main Street Score – Wall Street Score
So, when Main Street is stronger than Wall Street, the Divergence Score is positive. The wider the positive spread, the more consumer strength runs ahead of investor expectations.
The sweet spot is on the positive side of the scale, stocks that read Undervalued or, even better, Deep Value. These are the stocks where consumer demand is running well ahead of Wall Street expectations.
- +60 to +100 = Deep Value
- +10 to +59 = Undervalued
- -20 to +9 = Fair Value
- -60 to –21 = Overvalued
- -100 to –61 = Deeply Overvalued
The new Top Divergence tab lets you scan these differences across the market at a glance – making it easy to zero in on mispriced, undervalued stocks.
Mike Burnick’s Bottom Line: Our Social Heat Scores can give you an edge in predicting the market’s next winners. We harness the power of consumer buzz to provide you with unique insights on stocks with popular products and services. And when Main Street enthusiasm diverges from Wall Street expectations, you have an edge at uncovering new opportunities ahead of the crowd.
Good investing,
Mike Burnick
Senior Analyst, TradeSmith
P.S. Wall Street may not pay the average consumer much mind, but word of mouth is one of the best ways to bump up sales – and when Main Street gets talking, there are opportunities to be found.
TradeSmith’s Social Heat Scores give you an edge by turning online discussion and social sentiment into actionable data, enabling you to make trades on companies before Wall Street notices just how popular they’ve become in the last quarter.
That data can offer unexpected insights when it comes to quarterly reports… and that’s why Andy and Landon Swan built Earnings Season Pass.
Earnings Season Pass takes the power of the Social Heat Score one step further each earnings season, translating Main Street data into more immediate profit opportunities – by forecasting whether a stock will beat, meet, or miss Wall Street expectations in its next report.
This earnings season, that data – and the analysis of the Swans – is going to be critical. All eyes are on the AI companies driving markets higher… and how those companies report in the coming weeks could change the trajectory of stocks for months.
It’s a topic the Swans have been focused on for months – and that’s why they’re going live this Thursday, Oct. 1 at 1:00 p.m. Eastern for their AI Earningsevent. There, attendees will be briefed on the list of the downstream companies they think are about to move in the wake of the biggest AI names, and how they plan to trade them.
There’s never been a better time to get familiar with the Social Heat Score… but you’ll need to be quick to make the most of the opportunity.
Click here to reserve your space at the event – and get ready to follow the money.