

Some of the market’s best bargains are hiding in plain sight right now, and one of my favorite TradeSmith indicators says they may not stay cheap for long.
While the S&P 500 sits at all-time highs, nearly half its stocks are down 20% or more this year. Many of them are deeply oversold and heading into what has historically been the strongest stretch of the year for stocks.
That’s the technical definition of a bear market. Let’s call it a stealth bear market for the “average” stock.
It’s been hiding behind a market that has been all over the map in 2026. We saw a -10% correction early in the year, followed by a rapid +17% rally in just two months during April and May. Since then, stocks have been mostly stuck in a sideways trading range between 7,500 and 8,000 on the S&P 500.
But this trading range masks a lot of action beneath the surface, and most of that movement has recently been to the downside.
That’s because only a select few stocks – mainly the Magnificent 7 (with a little help from their technology friends) – have done all the heavy lifting for the index.
The good news is that many of these beaten-down stocks are now poised to rebound, thanks to favorable seasonal trends at this time of year. In fact, the fourth quarter has historically been a great time to make money in stocks.
So, in today’s issue of Inside TradeSmith, let’s search for seasonal profit opportunities using our Trade Cycles Seasonality Calendar.
That’s where you’re likely to find the best seasonal profit opportunities for individual stocks.
By my count, more than 160stocks in the S&P 500 are flashing optimal seasonal buy signals in the next 30 days alone. And every one of them has historically delivered annualized gains of 20% or more!
Clear Your Calendar for a Windfall of Seasonal Profit Opportunities
The thing about stock market seasonality is that the best profit opportunities tend to come in bunches at certain times of the year. And now is one of those times.
Our Trade Cycles Seasonality tools let you pinpoint potential bullish seasonal patterns for individual stocks, ETFs, and other assets tracked in the TradeSmith database. These are historically reliable periods, repeating year after year, when certain assets have typically trended higher.
And we’ve just entered a seasonal sweet spot for stock market gains!
It’s part of the proven four-year cycle for stocks. This is a midterm election year, with Election Day just four weeks away. And one of the most powerful periods of that four-year cycle just started.
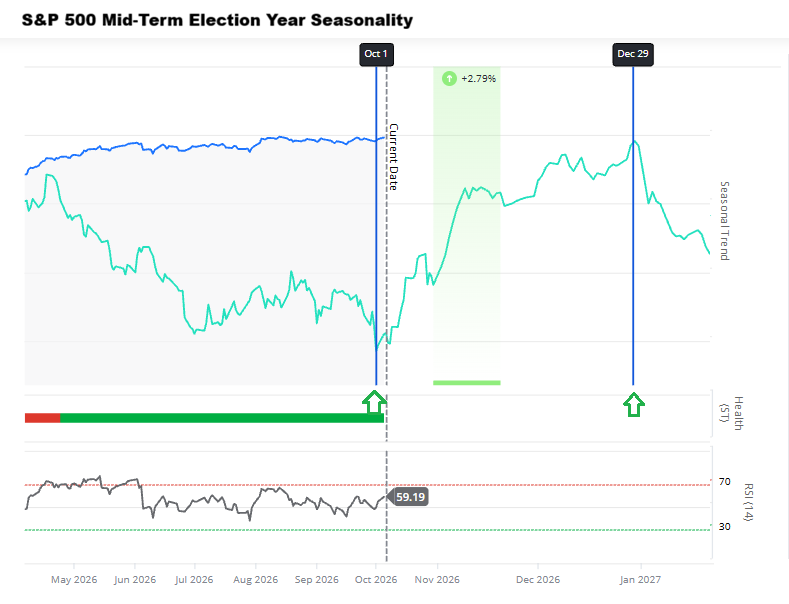
- Our Trade Cycles Seasonality chart above shows the S&P 500 has been up 83.3% of the time from Oct. 1 through Dec. 30 in midterm election years.
- Historically, stocks have posted average returns of 6.8% during this period. That’s more than double the 2.9% average return across all other years.
Here’s a summary of these bullish seasonal stats, straight from our Trade Cycles database.

With our exclusive Seasonality Calendar, you can find plenty of stocks poised for even bigger gains. It gives you a day-by-day view of seasonal trading opportunities as they arrive – so you can easily plan your trades in advance!
And a quick glance at the calendar shows a target-rich seasonal trading environment just ahead.
Let’s take a closer look…
A 30-Day Forecast from Our Seasonality Calendar
To access the Trade Cycles Seasonality Calendar, simply log in to your TradeSmith Finance Dashboard and open the Calendar page from the main menu bar at the top. Next, select the Trade Cycles Calendar tab on sub menu, as shown below:
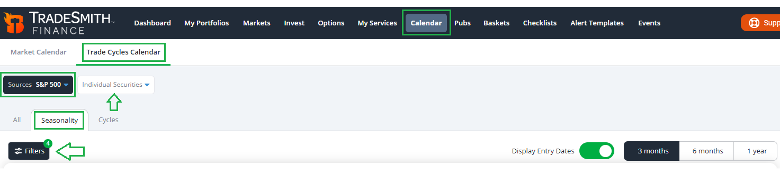
Members with Trade Cycles and TradeSmith Platinumsubscriptionscan access the full range of TradeSmith’s Seasonality and Timing tools, including the handy calendar of upcoming bullish seasonal patterns on this page.
Note: If you don’t see this valuable calendar in your TradeSmith Finance platform – and you’d like to –contact our Customer Care team at 866-385-2076.
Once you’ve opened the Trade Cycles Calendar, you’ll notice you have plenty of options for customizing the seasonality data you want to view.
Simply click the drop-down menu labeled Sources at the top left of the page, as shown below.
From this menu, you can select any of your own saved portfolios or watchlists to review the upcoming bullish seasonal windows for those stocks.
You can also view seasonal windows for Newsletter portfolios you subscribe to, TradeSmith Model Portfolios, or TradeSmith Baskets.
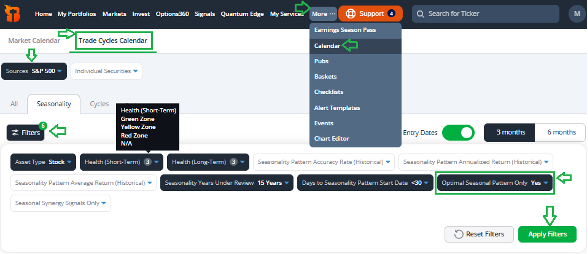
You can also look up a specific stock in a flash by simply clicking on the Individual Securities tab, to the right of Sources, and typing in the ticker symbol of your choice.
Finally, you can use the toggles on the far right to choose a time frame, reviewing seasonality across either the next 3 or 6 months.
Further down the page, under the Filters tab, we’ve included several preset filters to help you narrow your search for bullish seasonal patterns.
As shown above, I used these filters:
- Asset Type (Stock)
- Health (Green, Yellow, or Red Zone)
- Our Seasonality filters, to help zero in on the best seasonal profit opportunities.
- Seasonality Years Under Review: 15 years
- Days to Seasonality Pattern Start Date: less than <30
To illustrate how to use the calendar, I first chose the S&P 500 Index as my source here, which you’ll find under the TradeSmith Baskets tab.
Next, I filtered for Seasonal Patterns with the highest odds of success by toggling the Optimal Seasonal Patterns Only filter to Yes.
Here at TradeSmith, we performed extensive research to find stocks with the most ideal seasonal patterns and the highest accuracy rates. To qualify as an Optimal Seasonal Pattern, a stock must have…
- A historical accuracy rate of 80% or higher…
- An average historical return of 4% or more…
- An annualized return of 20% or greater…
- And at least 15 years of historical data.
With all these filters set, I clicked on the green Apply Filters button to see my results in the Calendar view – which you can see for yourself below:
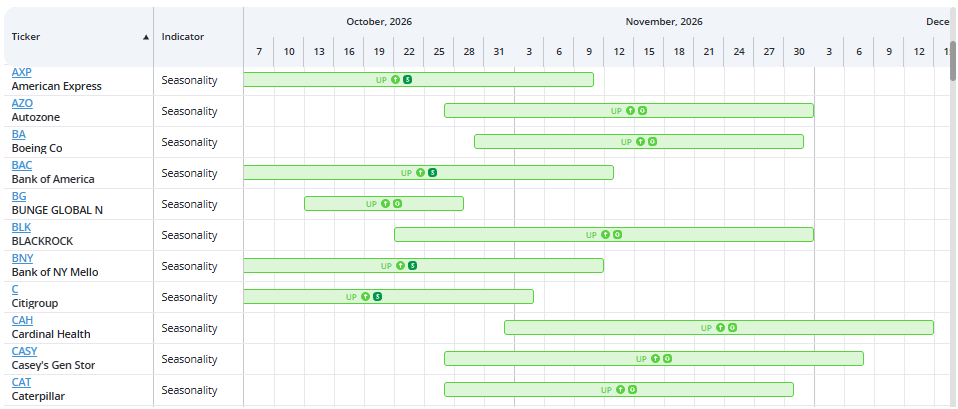
As you can see, there are plenty of seasonal profit opportunities to choose from over the next few months. In fact, I found two pages of S&P 500 stocks with bullish seasonal patterns coming up soon.
The screenshot above just shows a few results, but scrolling down the page will reveal plenty more!
The green-shaded calendar periods labeled UP display the bullish trade windows identified by our Seasonality tool.
Simply hover over the shaded period for any stock, and a pop-up window gives you all the key details about the upcoming seasonal pattern, including the exact start and end dates, historical average return, accuracy rate, and more.
For example, Bank of America (BAC) has an Optimal Bullish seasonal window that opened just a few days ago and runs through Nov. 13.
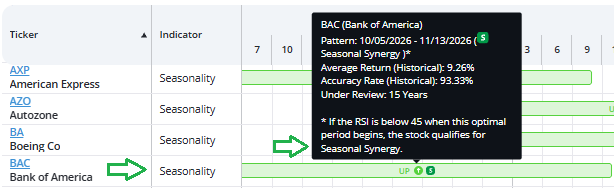
Over the past 15 years, BAC shares have gone up 93.3% of the time during this period, posting average returns of 6.3%.
By clicking on the ticker symbol at the left of the results list, you can jump straight to the Asset Details page for BAC or any of the other results.
From there, you can dig deeper by reviewing the stock’s Health and Risk ratings, browsing recent financial results, or even taking a closer look at the Seasonality data – or any of your other favorite TradeSmith indicators.
Mike Burnick’s Bottom Line: 2026 has been a tricky year for the stock market. But we’ve just entered a target-rich climate for bullish seasonal stock trends.
With the Trade Cycles Seasonality Calendar, you can build your own watchlist of bullish seasonal stocks and set alerts to notify you on the exact day when these stocks start to make their move. With just a few clicks, you can mark your calendar for seasonal opportunities throughout the year!
Good investing,
Mike Burnick
Senior Analyst, TradeSmith
P.S. As you’ve seen today, some of the market’s best opportunities arrive on a predictable schedule. But TradeSmith’s Chief Quantitative Strategist Mike Carr has narrowed that timing down to a single day each month: the ninth trading day.
Mike built an entire system around buying five blue-chip stocks on exactly that day, and only that day. In backtesting, it has shown the potential to double your money roughly every 19 months, with no options or leverage.
He’s also mapped the strongest historical “surge windows” for 10 of America’s biggest stocks, including one Nvidia window that has historically delivered 179% annualized returns with 93% accuracy. It’s all inside his new book, The Green Day Almanac, which is yours free for watching his new demonstration.
This month’s ninth trading day is Tuesday, Oct. 13, when Mike’s next five stocks go out at 10:30 a.m. Eastern.
Click here to see Mike’s system and claim your free copy now.