

We’re right in the thick of third quarter earnings season this week, with Wall Street preparing for reports from tech heavyweights Microsoft (MSFT), Amazon (AMZN), and Google parent Alphabet (GOOGL) – all scheduled to arrive over the next few days.
So far, 83% of S&P 500 companies have reported positive earnings surprises, beating Wall Street estimates in the process. But many of them have been punished, even after posting positive surprises.
Case in point: Facebook parent Meta Platforms (META), which beat both sales and profit estimates last week… only to see its shares drop 7% the next day.
As major players in the AI space, analysts will be watching out for updates on spending and direction… and if those analysts they don’t like what they hear, investors could be in for a bumpy ride.
That’s because earnings season is a well-known source of high market volatility. Likewise, high-profile earnings reports are well known for their habit of causing unexpected market moves… for both individual stocks and even entire indexes.
That’s why now is a great time to check in with two of my colleagues – TradeSmith Senior Analysts Andy and Landon Swan, the brothers behind MegaTrends and Earnings Season Pass.
Follow the Buzz with Social Heat Scores
I’ve covered the Swan brothers in recent issues of Inside TradeSmith, and you can click here to read more about their unique analysis.
But, to briefly recap: The Swans closely track consumer preference data – keeping a close eye on the online buzz about products and services that folks are buying and recommending on social media.
That data is then distilled and used to generate our easy-to-use Social Heat Scores, which track consumer momentum over time.
These scores can give you a valuable edge and help you spot companies with Main Street momentum, powered by consumers… before that strength is noticed by Wall Street and gets reflected in the stock price!
According to Andy and Landon, “A strong earnings report can reinforce what our Social Heat Score data has been showing for months.”
And when a stock falls after releasing strong earnings numbers – like META – it’s worth taking a closer look at consumer demand, to see if the price drop is a terrific buying opportunity.
The Social Heat Score combines real-time consumer engagement stats with market data, enabling it to consistently spot and grade shifts in consumer demand. Increased consumer sentiment can soon show up in a company’s bottom line – boosting its stock price in the process.
And there’s an easy way to find disconnects like this, where Main Street consumer enthusiasm clashes with Wall Street pessimism.
Members with subscriptions to MegaTrends, Earnings Season Pass,or TradeSmith Platinum can find this data right on their Home page. Simply log into your TradeSmith Finance platform and scroll down the page to find the Social Heat Score panel, as shown below:
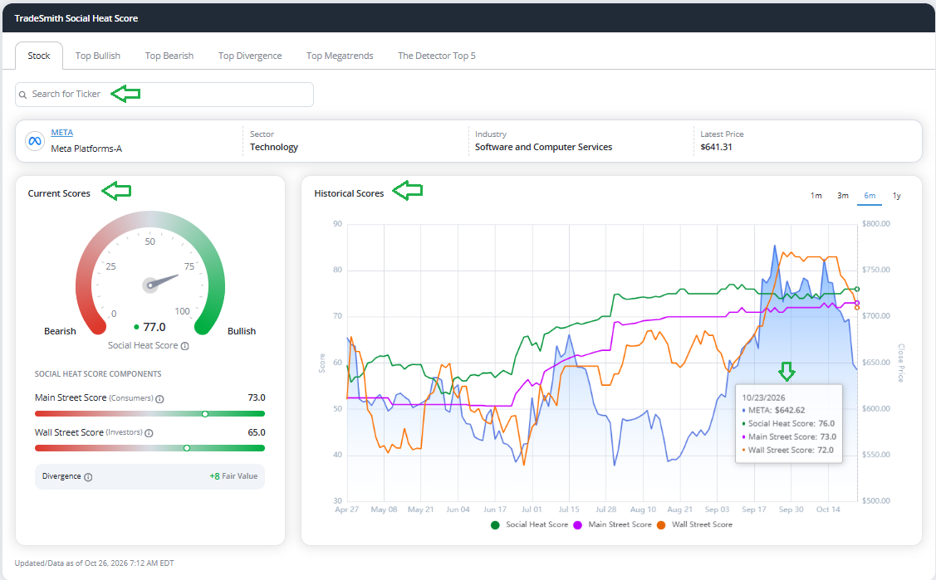
From the Social Heat Score panel, you can search Social Heat Scores for any stock by using the Search for ticker window at upper left. You can also view the current Top Bullish and Top Bearish Social Heat Scores by selecting these tabs at the top menu bar.
The Top Bullish tab displays stocks with the highest Social Heat Scores, while Top Bearish shows you the lowest scores in our database.
By reading the chart on the right, you can track changes in the Social Heat Score over time, along with the stock price and two other key metrics – The Main Street Score and the Wall Street Score.
More on those two Street Scores in a moment.
Top Divergence Is Your Key to Big Opportunity!
For my money, the best place to spot potential winning stocks before they make a big move is the Top Divergence tab, shown below:
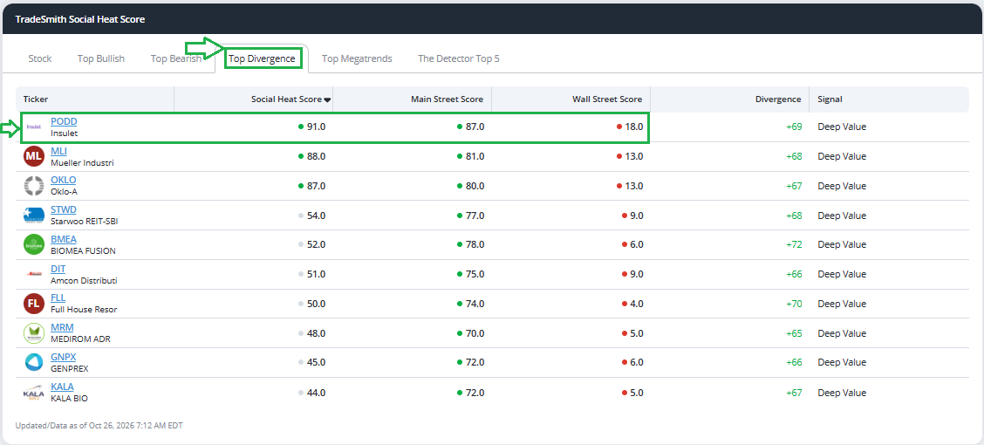
This tab lists stocks with the biggest disconnect between high Main Street consumer enthusiasm and low Wall Street expectations. Alongside the proven Social Heat Score, you’ll also find the Main Street Score, Wall Street Score, and the Divergence between the two listed for each featured stock.
Case in point: Right at the top of the list above is medical device maker Insulet (PODD).
PODD has a sky-high Social Heat Score of 91, just a few points away from the maximum score of 100. PODD’s Main Street Score is a very bullish 87… but the stock has a Wall Street Score of just 18!
This is a big divergence between Main Street and Wall Street (+69), which suggests that PODD is deeply undervalued… and that means a big opportunity for an upside reversal.
The Main Street Score measures actual consumer enthusiasm for a company’s products and services. When consumer sentiment rises, sales and profit growth may also be on the rise – even if it hasn’t shown up in the reports Wall Street analysts pay attention to.
The Wall Street Score, on the other hand, reflects investor expectations about the company. If Wall Street doesn’t expect much, that means a low bar for the company to jump over during earnings season.
Naturally, the Divergence Score measures the difference between the two Street Scores. So, a strong Main Street Score coupled with a low Wall Street score spells opportunity… and the wider the divergence, the more opportunity and upside potential a stock may have!
That’s why the Top Divergence tab is a great resource – it’s an easy way to find hidden rebound opportunities like PODD with just a few clicks.
Mike Burnick’s Bottom Line: Social Heat Scores give you an edge in predicting stocks with rising consumer enthusiasm. And when low Wall Street expectations contrast with high Main Street enthusiasm, these divergences can create opportunities to profit from stocks in the sweet spot.
Good investing,
Mike Burnick
Senior Analyst, TradeSmith
P.S. The Social Heat Scores – and the Top Divergences list we explored today – offer powerful insights into consumer spending and enthusiasm that many Wall Street analysts overlook.
Andy and Landon Swan, my colleagues at MegaTrends, spend their days combing through this data to refine their tools and discover new market opportunities.
Recently, the Swan brothers made a major discovery: The stocks with the highest Social Heat Scores weren’t always the best performers over the course of a month.
Instead, they found that stocks within a set range of scores produced better results month-to-month. Stocks with a lot of buzz building around them, but that weren’t yet at a fever pitch.
Andy and Landon call this the “sweet spot” – and they’ve teamed up with Wall Street legend Marc Chaikin to develop a new system to capitalize on their breakthrough.
Testing this new system across roughly six years of market data, their new strategy could have turned $1,000 into $8,080. Over the same stretch, the S&P 500 would have turned that same $1,000 into just $2,300.
Earlier today, the Swans debuted their new Social Heat system at The Stock Tsunami Event – sharing details on how it all works and how leveraging the Social Heat Score and Marc’s own research opened the door to incredible opportunities each month.
To learn more about the new system – and how to put it to work – click here to watch the replay of this afternoon’s event.
Just be sure to act quickly: The first batch of new trades are set to arrive next week.