After the Dip, Now’s the Time to Take Advantage of Our Model Portfolios!
Americans paused to give thanks last week – for the many blessings we all share. But as thankful as investors have been for the year’s profits, they seem a bit leery about the state of the stock market after the recent selloff.
Still, as far as market pullbacks go, this one has been fairly mild compared to some selloffs I’ve experienced over the last few decades.
And there’s more good news, too: Several market-breadth measures I follow are signaling that the pullback may be over already, or at least close to it!
The percentage of S&P 500 sectors trading above their 50-day moving averages enjoyed a breadth-thrust last week, moving from under 20% to over 90% in just a matter of days. Meanwhile, the 10-day average of new lows vs. new highs on the New York Stock Exchange swung from -100 to +100 in just six days.
And to top it all off, the McClellan Oscillator – an indicator of declining vs. advancing stocks – rebounded from -100 to +100 in just four days!
Taken together, these three bullish reversals in market breadth have often signaled stock market lows in the past. And the reversals are coming at a great time, as history also suggests that investors should get a seasonal dose of holiday cheer from the stock market this month.
As you can see from this monthly seasonal statistics chart, courtesy of TradeSmith’s Seasonality tools, the S&P 500 has posted median gains of +2.56% over the past 15 years:
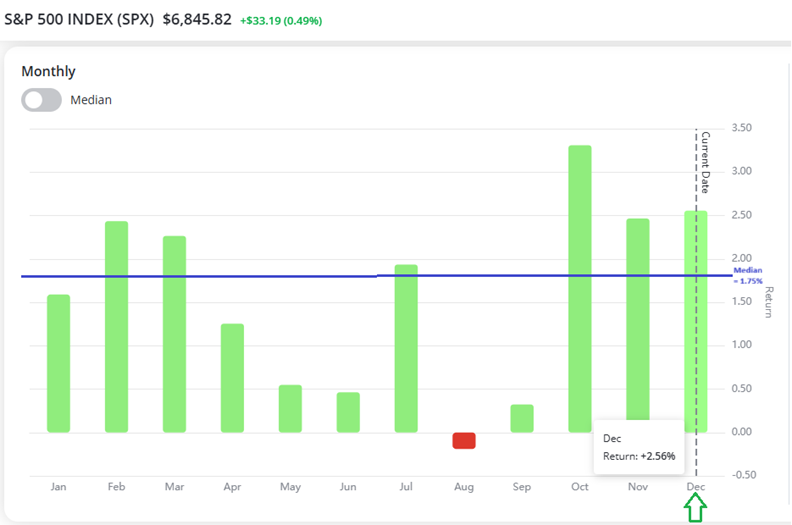
That’s well above the S&P 500’s median gain of 1.75% for all months over the last 15 years. In fact, December is the second-most bullish month of the year for the month after October.
And even better, the S&P 500 has risen in December 73.3% of the time over that same 15-year period! This tells me that, should the typically bullish pattern play out as usual, stocks should enjoy a nice seasonal boost into year end!
Members with subscriptions to Trade Cycles and TradeSmith Platinum can access these Seasonality statistics charts to get historical trend data for hundreds of different assets and securities in our database. They’ll even tell you the best day of the week and the best week of the month to buy or sell!
That’s all thanks to a recent upgrade to our already-powerful suite of seasonality tools – but that’s not the only data-driven bombshell we’ve dropped this year. As TradeSmith celebrates its 20-year anniversary, we’ve been quite busy… and today’s a great time to show off some of our latest developments.
We’ve seen already that markets are primed to benefit from a potential December uptrend. Now, the question is, how do you position yourself to capture profits this month?
A great place to start answering that question is the TradeSmith Model Portfolios page – where you can access plenty of new buying ideas, courtesy of some of our newest trading tools.
Take Advantage of Holiday Sales with TradeSmith Model Portfolios!
All of the automated model portfolios we’ve developed this year – all powered by TradeSmith’s cutting-edge software – are now conveniently located in one place.
Members with subscriptions to TradeSmith Platinum, Trade Cycles, and The AI Super Portfolio can review their portfolios at a glance on the Invest page of TradeSmith Finance, simply by clicking the Model Portfolios tab as shown below:

This centralized hub gives you direct access to a curated selection of portfolios designed by our team, with each and every one designed to help you make smarter, more confident investment decisions.
These automated portfolios are built using our proprietary TradeSmith algorithms and methodologies, offering data-driven guidance tailored to various investing goals.
At a glance, you can explore:
- A description of each portfolio’s approach and investment objective…
- The current open and closed positions in each portfolio…
- Performance metrics in the overview tab to track progress…
- And clear guidance about how each portfolio may fit into your own style and goals.
On the Model Portfolios page, you’ll see an Overview and Portfolios tab.
The Overview tab includes a brief description of each portfolio, how it’s constructed, and the type of investor it is generally intended for.
Here’s a screenshot of our Trade Cycles Seasonal Edge portfolio as an example.
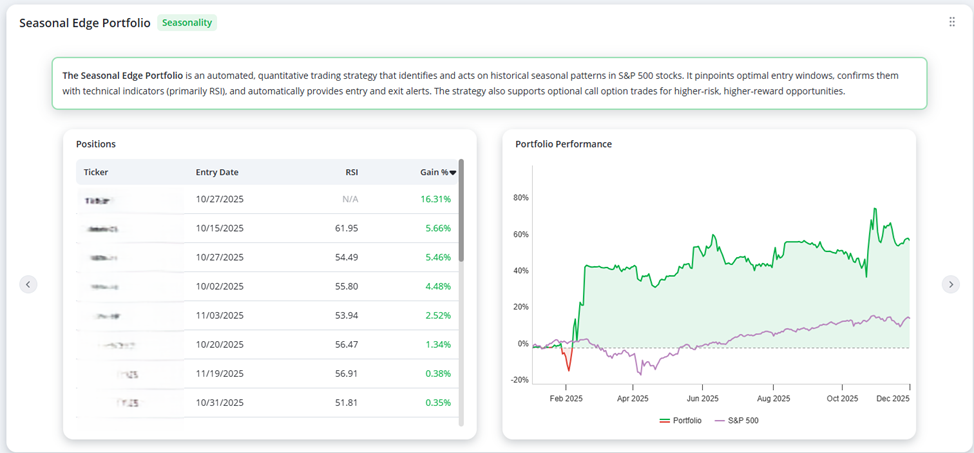
You can find plenty of additional information on the entry and exit strategy for each portfolio, and who should consider following the strategy by simply clicking on the left or right arrows shown above.
The Portfolios tab takes a deeper dive into the portfolio holdings, both current open positions as well as closed. For instance, here’s a screenshot of our Predictive Alpha AI Super Portfolio:
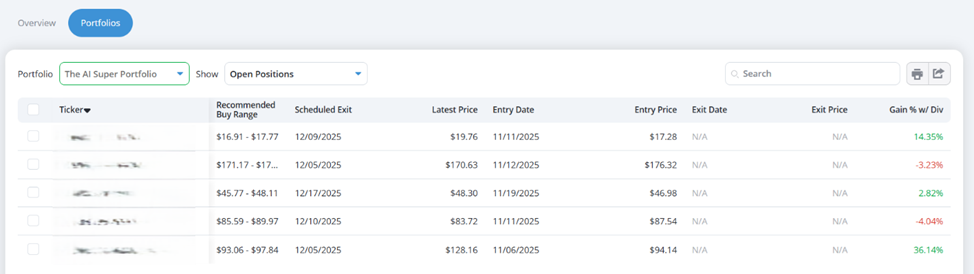
We’re actively working to expand our offerings on this page, with new model portfolios already in development. So, be sure to stay tuned as we continue to enhance your investing experience with innovative tools and strategies — all in one place.
Access to the Model Portfolios page, and the portfolios on that page, are dependent on your TradeSmith subscription.
TradeSmith Platinum members have access to all of our portfolios (and early access to new portfolios as they release), while the AI Super Model Portfolio is only available to TradeSmith Platinum and AI Super Portfolio members, for example. And the Seasonal Edge Portfolio is available only to Platinum members and those with Trade Cycles subscriptions.
If you don’t have access to one or more of our Model Portfolios yet, be sure to contact us right away to learn more – by giving our Customer Care team a call at 888-623-0858.
Mike Burnick’s Bottom Line: Holding the right stock at the right time is the key to investment success. The timing part of this equation should be in your favor after the recent market dip and with bullish seasonality this month. The key question is, what to consider buying? Our TradeSmith Model Portfolios can help you answer that question by taking some of the guesswork out of your investment decision making.
Good investing,
Mike Burnick
Senior Analyst, TradeSmith
P.S. The AI Super Portfolio and Seasonal Edge model portfolios are just two of the new tools we’ve released this year – as the TradeSmith team of researchers, analysts, and developers continues to find new ways to enhance your portfolio and help you capture potential profits. It’s all part of our commitment to putting hedge fund-level tools into the hands of everyday investors.
The model portfolios we reviewed today use a selection of TradeSmith indicators to find high-quality trade opportunities that can fit any number of investment goals and trading styles. And while each portfolio uses just a small handful of indicators, one of the most effective ways to use the TradeSmith software suite is to combine them – and use them to take command of your investment journey.
But to get easy access to all the proven analytic data, market indicators, and TradeSmith tools we offer – from the Seasonality statistics to the new Model Portfolios, and even some new tools coming down the pipeline – you’ll need a subscription to TradeSmith Platinum.
For my money, the Platinum level of access is well worth it. We’re talking about hedge-fund level analytics, all at your fingertips – enhanced with research and market insights from analysts across TradeSmith.
Just a few winning trades over the next year can easily pay for this VIP membership, and thanks to the major upgrades we’ve rolled out over our 20-year anniversary in 2025, we’ve made finding those trades easier than ever.
As we enter the last month of the year, and markets are set to move, it’s a great time to consider making the jump to Platinum if you haven’t already.